Hello Helical Team,
is it possible to write back and update some data in the db? Using Helical Insight enterprise edition 4.1 GA.
Thank You,
Netta.

Hello Helical Team,
is it possible to write back and update some data in the db? Using Helical Insight enterprise edition 4.1 GA.
Thank You,
Netta.
Hello Netta,
In this article, you will learn about Updating DB data from Front End using “Report CE”module. Hence people who are using both community edition and enterprise edition can use it. This requires a lot of custom work, that is why we are using report CE module to do it. This can be done using custom data table plugin.
We will create a tabular report, we implement logic on the required column to be updated from the editable cell in the tabular report. Once we click on the configured cell it changes to editable cell then we should change cell value. After that the update button will be enabled , again we need to confirm the change.
It will update the DB , the DB updation logic is written in hwf. We will call hwf using ajax call, need to send required inputs for hwf.
Steps to be followed to create Report/Dashboard :
We are going to explain by creating a sample tabular report using Custom VF . This module contains contains 4 sections :
For detailed description of each module, please follow the below link :
1. Data source :
Create data source connection.
Here we are using connection type : Groovy Plain JDBC
In the configuration of data source, provide the details as shown below.
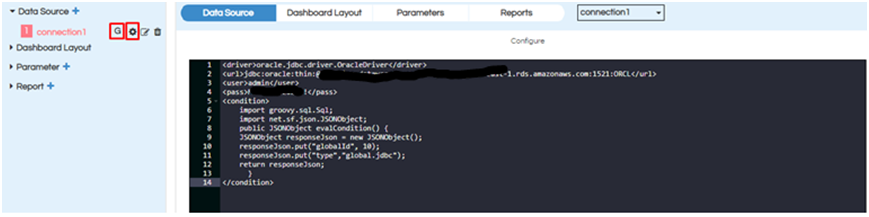
Note : You can choose other kind of data sources. The rest of the steps are the same as others.
** 2. Dashboard Layout :**
In the dashboard layout we basically specify the layout of the reports, dashboards and input parameters which we are creating. All the divs are specified here within which they get rendered.
Here we are creating 1 divs: Report
Report div is: report
When you click on dashboard layout a layout similar to below will appear:
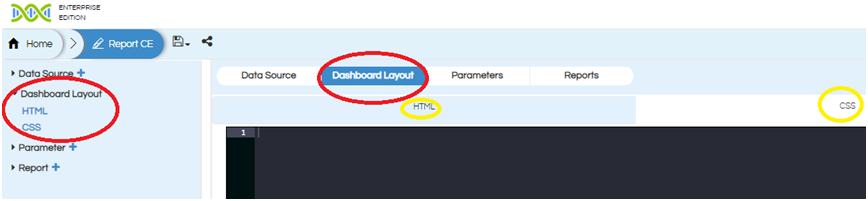
In the above screen shot we find two options (left side)
HTML and CSS .
If you click on HTML/CSS the place holder for respective component will be displayed and highlighted in the Dashboard layout panel.
We can place the code related to HTML, CSS for dashboard layout and styling.
Dashboard layout:
HTML :
<link rel="stylesheet" type="text/css" href="getExternalResource.html?path=1631881114517/Dependencies/jquery.dataTables.css"></link>
<script src="getExternalResource.html?path=1631881114517/Dependencies/Files/jquery-ui.js"></script>
<div class="col-sm-12">
<div class="row" style="margin-top: 25px;">
	<div class="col-sm-12">
		<h2 style="text-align: center;" id="heading" class="heading">UCCIDs Report</h2>
	</div>
</div>
<div id="report" style="margin-top: 25px;"></div>
</div>
CSS:
#table_paginate , #table_filter {
float: left;
}
input{
    height : 28px !important;
}
3. Parameters :
I don’t have parameters so I have directly gone to report.
Note: If you do not have any parameters please make sure that you will have to add below code in the“Report”configuration as shown in below.
4. Report :
We can configure different visualizations to render in different divs in the dashboard layout.
When click on add report button, the layout will appear as show below :
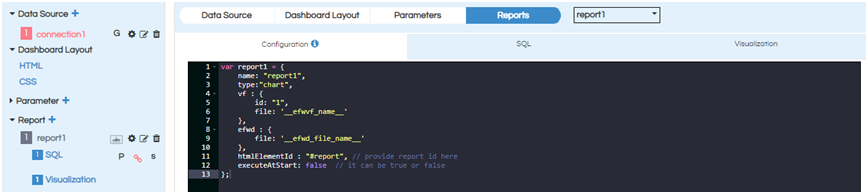
In the left panel we find report, SQL, Visualization related options.
Click on configure, on the right side we can see the place holders for report configuration, SQL, Visualization. Place the respected code apply click on apply.
Here we need to choose chart type as “Custom”, connection as “connection1”
Report Configuration :
var report1 = {
    name: "report1",
    type:"chart",
    vf : {
        id: "1",
        file: '__efwvf_name__'
    },
    efwd : {
        file: '__efwd_file_name__'
    },
    htmlElementId : "#report", // provide report id here
    executeAtStart: true // it can be true or false
};
SQL :
import  com.helicalinsight.adhoc.metadata.GroovyUsersSession;
public String evalCondition() {
String responseJson;
responseJson = "select SHIP_TO,ADDRESS,CITY_STATE_ZIP,SHIP_ZIP_BARCODE,PO,sum(PACK_QTY) as QTY,STYLE,COLOR_NO as COLOR,SIZE_NAME,UPC_NO as UPC,sum(PACK_QTY) as QTY_UPC,UCCID,PACK_SERIAL_NO,'Update' as \"__\" from MAROLINAWH.UCCID_128  group by SHIP_TO,ADDRESS,CITY_STATE_ZIP,SHIP_ZIP_BARCODE,PO,PACK_QTY,size_num,STYLE,COLOR_NO,SIZE_NAME,UPC_NO,UCCID,PACK_SERIAL_NO order by style,color_no,size_num"
return responseJson;
}
Note: Here I have created one button as Update, so whenever I want to update a record, I can edit and update that record.
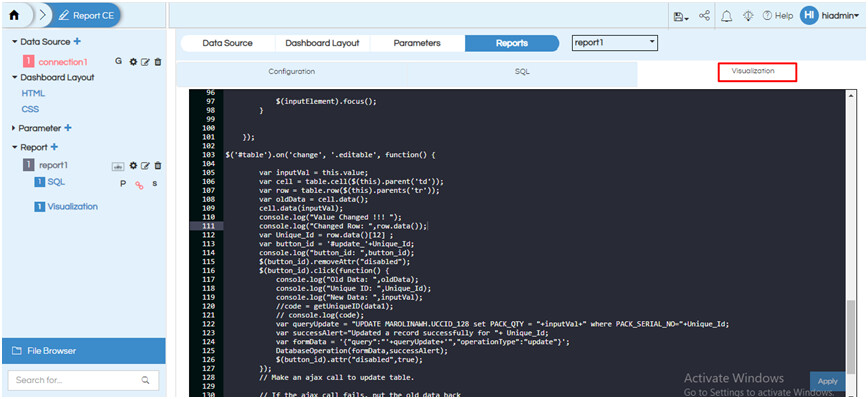
Visualization :
if(data.length == 0)
{
$('#chart_1').html("<div ><h4 style='text-align:CENTER;color:black; padding-top:60px;'>No Data Available For Current Selection</h4></div>");
return;
}
else {
var script = document.createElement("script");
var script1 = document.createElement("script");
scriptLoaded = false;
if(window.DashboardGlobals)
script.src = window.DashboardGlobals.baseUrl+"/getExternalResource.html?path=1631881114517/Dependencies/jquery.dataTables.min.js";
else
script.src = "getExternalResource.html?path=1631881114517/Dependencies/jquery.dataTables.min.js";
if(window.DashboardGlobals)
script1.src = window.DashboardGlobals.baseUrl+"/getExternalResource.html?path=1631881114517/Dependencies/Files/jquery-ui.js";
else
script1.src = "getExternalResource.html?path=1631881114517/Dependencies/Files/jquery-ui.js";
script.async = false;
document.getElementsByTagName("head")[0].appendChild(script);
document.getElementsByTagName("head")[0].appendChild(script1);
function tabulate(elem, data, columns) {
var table = d3.select(elem).append("table").attr("id","table").style('display','none');
var thead = table.append("thead");
var tbody = table.append("tbody");
thead.append("tr")
.selectAll("th")
.data(columns)
.enter()
.append("th")
.text(function(column) { return column.split('_').join(' '); });
var rows = tbody.selectAll("tr")
.data(data)
.enter()
.append("tr");
var cells = rows.selectAll("td")
.data(function(row) {
return columns.map(function(column) {
return {column: column, value: row[column]};
});
})
.enter()
.append("td")
.text(function(d) { return d.value; });
return table;
}
var subjectTable = tabulate( "#chart_1", data, Object.keys(data[0]));
script.onload = function(){
var table = $('#table').DataTable({
"bAutoWidth": false,
"pageLength": 250,
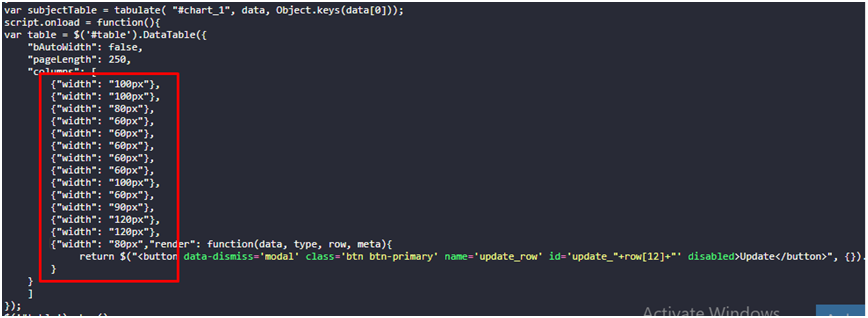
"columns": [
{"width": "100px"},
{"width": "100px"},
{"width": "80px"},
{"width": "60px"},
{"width": "60px"},
{"width": "60px"},
{"width": "60px"},
{"width": "60px"},
{"width": "100px"},
{"width": "60px"},
{"width": "90px"},
{"width": "120px"},
{"width": "120px"},
{"width": "80px","render": function(data, type, row, meta){
return $("<button data-dismiss='modal' class='btn btn-primary' name='update_row' id='update_"+row[12]+"' disabled>Update</button>", {}).prop("outerHTML");
}
}
]
});
$('#table').show();
}
}
Note: Update button will be disable mode until we edit any record.
Note: In this custom VF, we have to mention how many columns we are using, we have to declare them as shown in below image
Note: After placing the configuration , SQL , Visualization then click on apply or (control+s)
After completing all the steps save the community edition report :
In the back end server location the following files will be generated
Efw (report view in the front end)
Efwce (editable file in the front end)
Efwvf
Html
Efwd
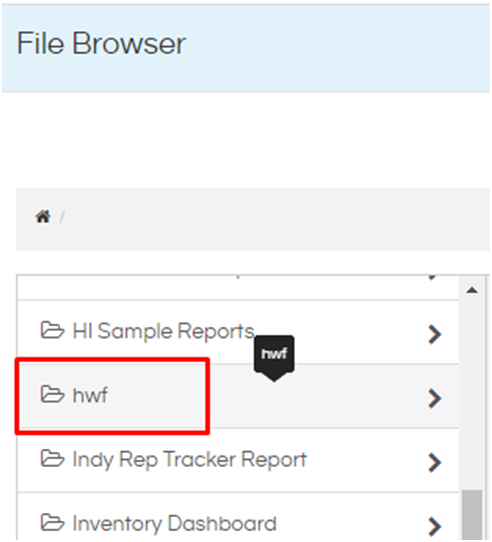
In the front end file browser we can see the below file types:
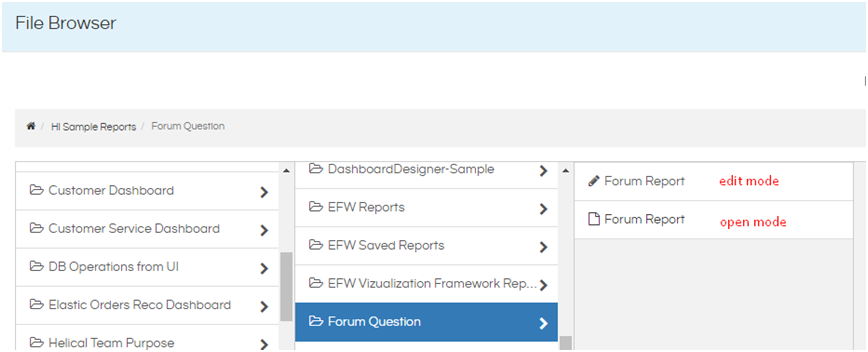
We should right click on the report view file (with the extension efw) choose open in new window then report opens like below. The other file with the extension EFWCE can be used to edit the created report/dashboard again.
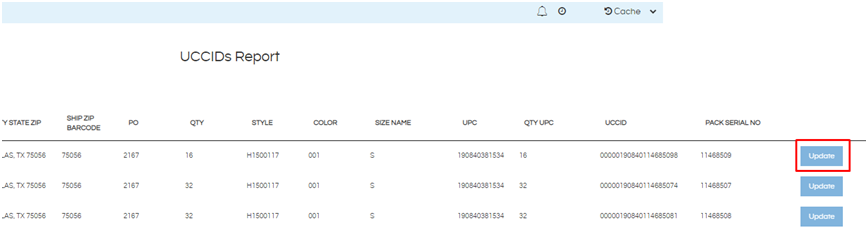
Report View :
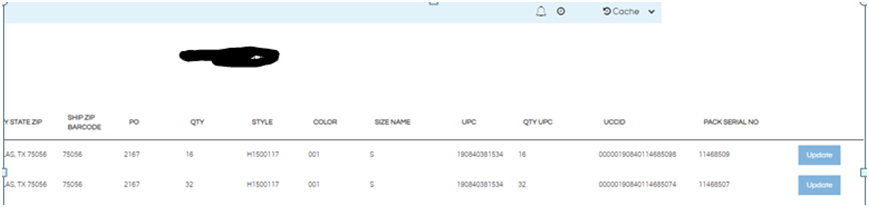
Updating Record from front End:
Here we want to edit QTY UPC column, so double click on that record It will show input box to edit, enter your value and click on empty space then update button will enable and click on update button to update record, we can edit as many records as we can, just we have to mention those column which we want to edit as shown below,
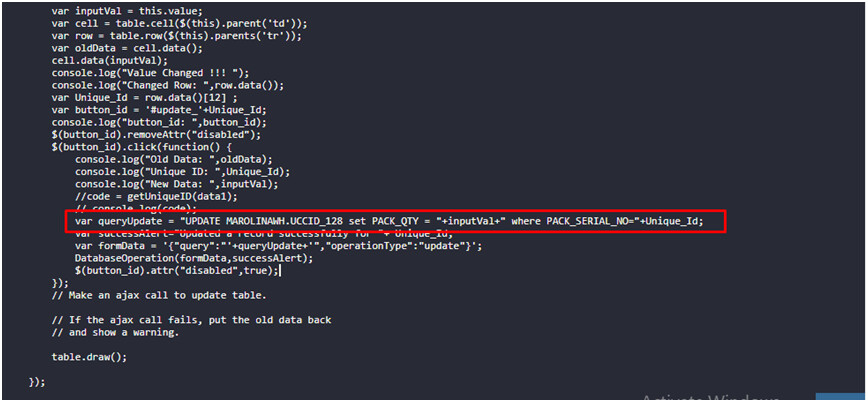
Update button code:
In visualization we have written this code
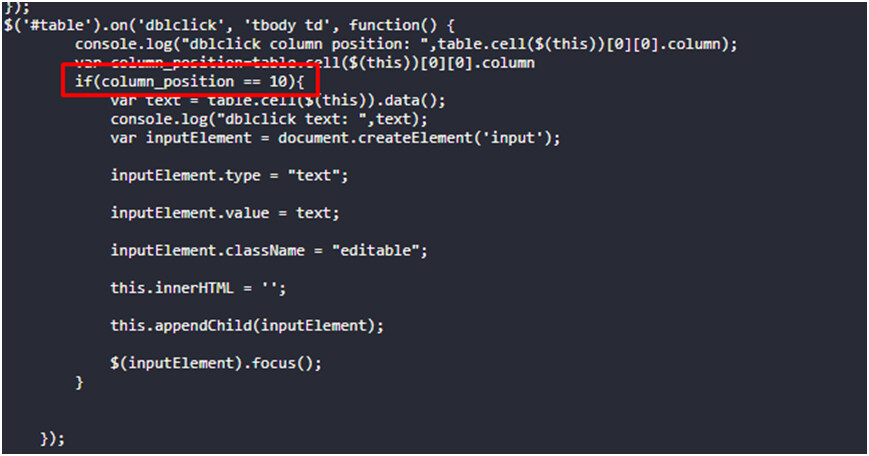
Update button and enable button code:
$('#table').on('dblclick', 'tbody td', function() {
        console.log("dblclick column position: ",table.cell($(this))[0][0].column);
		var column_position=table.cell($(this))[0][0].column
		if(column_position == 10){
			var text = table.cell($(this)).data();
			console.log("dblclick text: ",text);
			var inputElement = document.createElement('input');
			inputElement.type = "text";
			inputElement.value = text;
			inputElement.className = "editable";
			this.innerHTML = '';
			this.appendChild(inputElement);
			$(inputElement).focus();
		}
    });

$('#table').on('change', '.editable', function() {
        var inputVal = this.value;
        var cell = table.cell($(this).parent('td'));
        var row = table.row($(this).parents('tr'));
        var oldData = cell.data();
        cell.data(inputVal);
        console.log("Value Changed !!! ");
		console.log("Changed Row: ",row.data());
		var Unique_Id = row.data()[12] ;
        var button_id = '#update_'+Unique_Id;
		console.log("button_id: ",button_id);
	    $(button_id).removeAttr("disabled");
		$(button_id).click(function() {
			console.log("Old Data: ",oldData);
			console.log("Unique ID: ",Unique_Id);
			console.log("New Data: ",inputVal);
			//code = getUniqueID(data1);
			// console.log(code);
			var queryUpdate = "UPDATE MAROLINAWH.UCCID_128 set PACK_QTY = "+inputVal+" where PACK_SERIAL_NO="+Unique_Id;
			var successAlert="Updated a record successfully for "+ Unique_Id;
			var formData = '{"query":"'+queryUpdate+'","operationType":"update"}';
            DatabaseOperation(formData,successAlert);
			$(button_id).attr("disabled",true);
		});
        // Make an ajax call to update table.

        // If the ajax call fails, put the old data back
        // and show a warning.

        table.draw();

    });
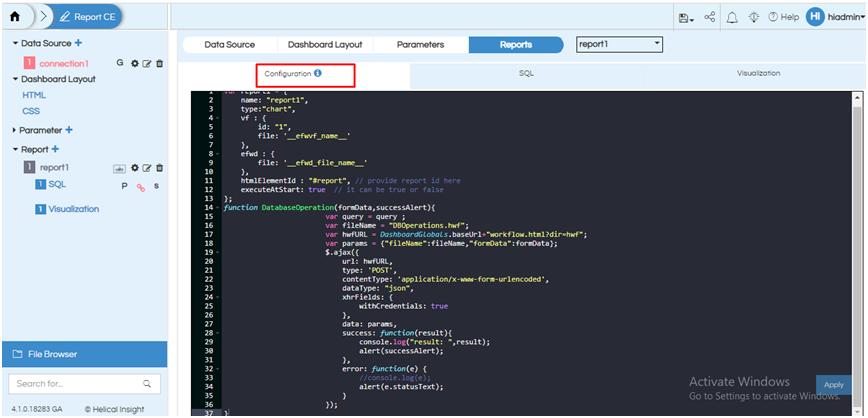
Code:
function DatabaseOperation(formData,successAlert){
						var query = query ;
						var fileName = "DBOperations.hwf";
						var hwfURL = DashboardGlobals.baseUrl+"workflow.html?dir=hwf";
						var params = {"fileName":fileName,"formData":formData};
						$.ajax({
		url: hwfURL,
		type: 'POST',
		contentType: 'application/x-www-form-urlencoded',
		dataType: "json",
		xhrFields: {
			withCredentials: true
		},
		data: params,
		success: function(result){
			console.log("result: ",result);
			alert(successAlert);
		},
		error: function(e) {
			//console.log(e);
			alert(e.statusText);
		}
	});
}
HWF Code:
<HWF mandatory="true" type="com.helicalinsight.HWFEngine">
	<input mandatory="true">
		<fetchData default="fetchData" type="helical.String">fetchData</fetchData>
		<formData default="" type="helical.String">formData</formData>

	</input>
	<flow>
		<execution alias="getQueryData" id="1" type="job.executeGroovy">
			<input>

				<ref for="functionName">fetchData</ref>
				<ref>formData</ref>

			</input>
			<code>
				<![CDATA[
				import net.sf.json.JSONObject;
				import net.sf.json.JSONArray;
				import java.sql.Connection;
				import java.sql.DriverManager;
				import java.sql.ResultSet;
				import java.sql.SQLException;
				import java.sql.Statement;
				import java.sql.CallableStatement;
				import java.sql.Types;

				public static JSONObject fetchData(JSONObject req, JSONObject responseJson) {
						JSONObject formData = JSONObject.fromObject(req.formData);
						if(formData.operationType == "update"){
							responseJson.put("response",DDL_Operation(formData.query));
						}
						return responseJson;
				}
				public static String DDL_Operation(String formJson) {
									System.out.println("*****Started*****");
									System.out.println("query :: " + formJson.toString());
									Connection conn = null;
									Statement stmt = null;
									String response = "" ;
									try {
										try {
											Class.forName("oracle.jdbc.driver.OracleDriver");
										} catch (Exception e) {
											System.out.println(e);
										}
										conn = (Connection) DriverManager.getConnection(
											"jdbc:oracle:thin:@marolina-datawarehouse.cdlzplbbmgzg.us-east-1.rds.amazonaws.com:1521:ORCL", "admin", "Marolina2021!!");
										System.out.println("Connection is created successfully:");
										stmt = (Statement) conn.createStatement();
										String query1 = formJson.toString();
										stmt.executeUpdate(query1);
										System.out.println("Record has been updated in the table successfully..................");
										response = "success" ;
									} catch (SQLException excep) {
										excep.printStackTrace();
									} catch (Exception excep) {
										excep.printStackTrace();
									} finally {
										try {
											if (stmt != null)
												conn.close();
										} catch (SQLException se) {}
										try {
											if (conn != null)
												conn.close();
										} catch (SQLException se) {
											se.printStackTrace();
										}
									}
									System.out.println("*****Ended*****");
									return response;
				}

				]]>
			</code>
			<output>re</output>
		</execution>

	</flow>

	<output mandatory="false">
<re type="com.helicalinsight.print">response</re>
</output>
</HWF>
Result:
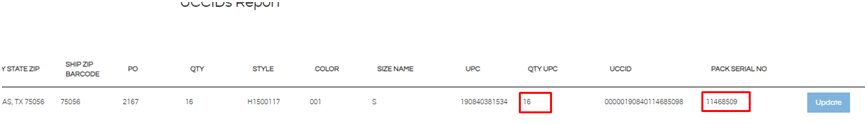
Before update the QTY UPC is 16 where pack serial no= 11468509
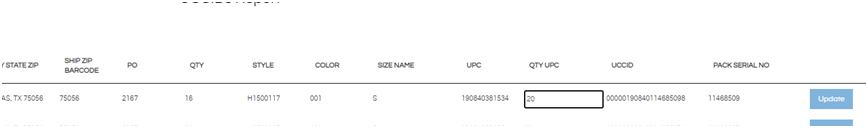
Double click on the record which we want to edit,
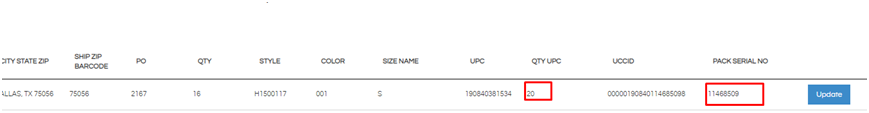
Now click on empty space, update button will enable and click on update button and refresh the page to see the updated value,
Thank You,
Helical Insight.