Hi,
The number of y-axis depends on number of measures in the selected fields as per design. We have passed on the information to Product team for enhancement. However, for your current needs we can have a workaround.
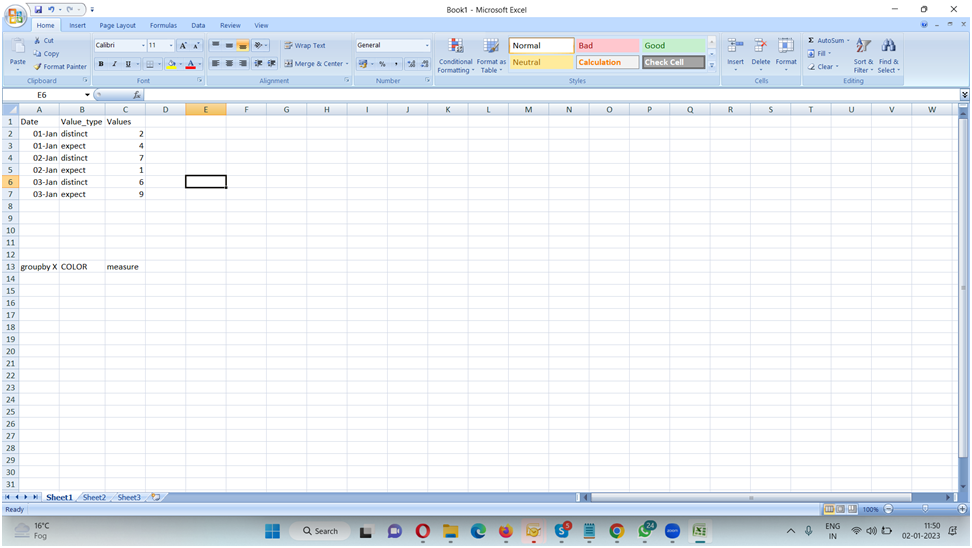
If you want to keep the same axis and have two lines based off of the same axis you may have to keep the records in same column. You can have two rows instead of two columns for each month and have additional column to identify which value is what. This extra column will go into ‘Marks’ option while the date and value will form the chart.
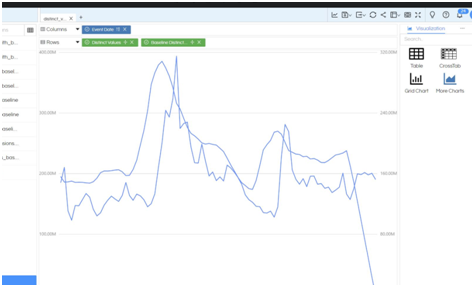
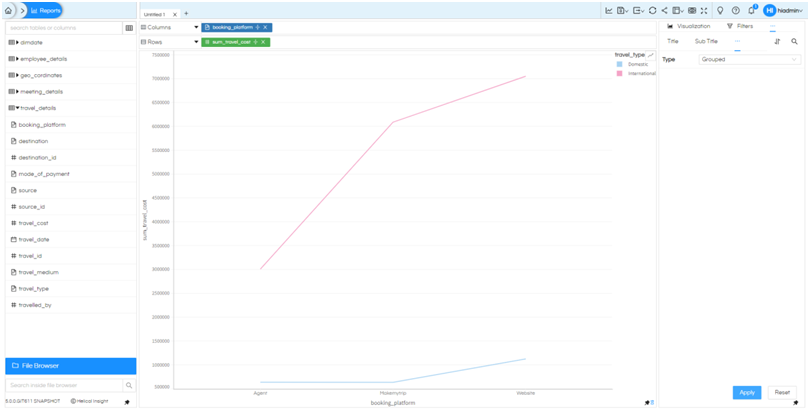
Including the similar chart from sample database as reference, where the dimension and measure forms a line chart which is giving two separate lines based on third parameter, going in ‘Marks’ option.
Similar to this if your data can have view as follows, the same logic can be applied to create the above chart.
Do share if you are able to implement it successfully. Or reach out for any further clarification.
Regards,
Support Team