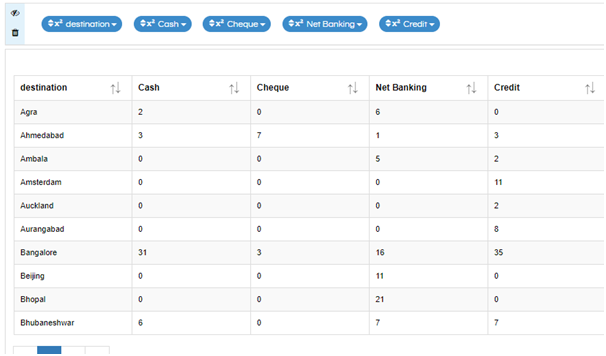
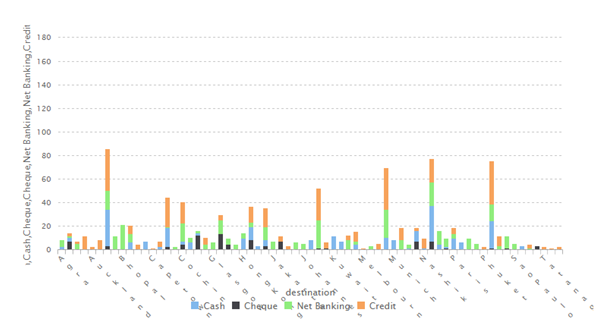
The default stacked bar works with 1 dimension (for the X axis) and multiple measures (one for each section of the stacked bar). Hence, your data should look like below:

Once your data is in the above format, you can select the stacked bar visualization.

You may find that the order of the sections is not the same as the order of the columns.
In your case since you want to have multiple. For defining the order of the sections as per your requirement, kindly StackedBar.zip (1.5 KB) and place it in the hi-repository. Use this VF file to create stacked bar chart.
You can select the columns that you want to use to generate the stacked bar chart and then call the VF by clicking on the VF option in the visualization ribbon and selecting StackedBar.efwvf
This blog will be really helpful how to use VF


