Hi,
By default the chart axis range is dynamically created using the minimum value and maximum value preset in the SQLQuery response.
However you can change this minimum and maximum value of a range sector for numeric columns.
By following below steps you can achieve this .
- Hover on the 3 dots which is present beside the Filters and you will get a dropdown in that select properties .
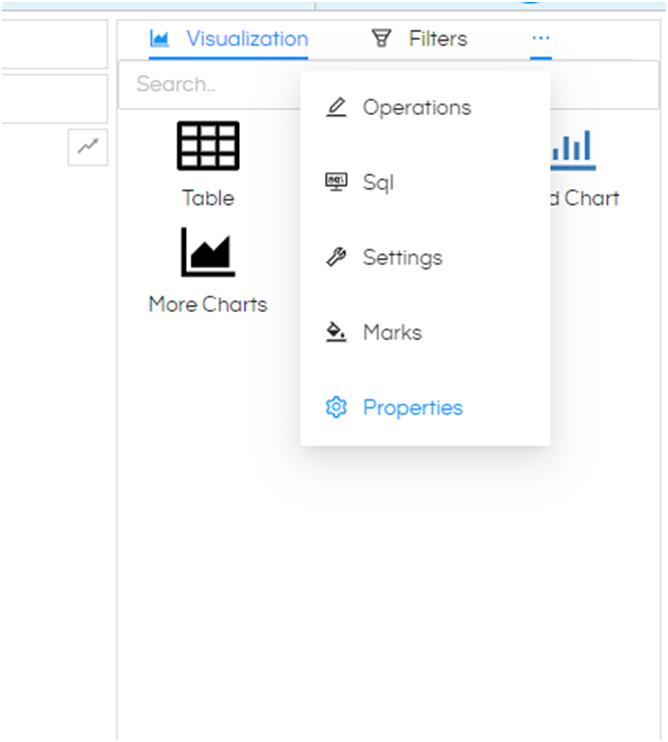
2.Now here click on Axis and you will see something like below
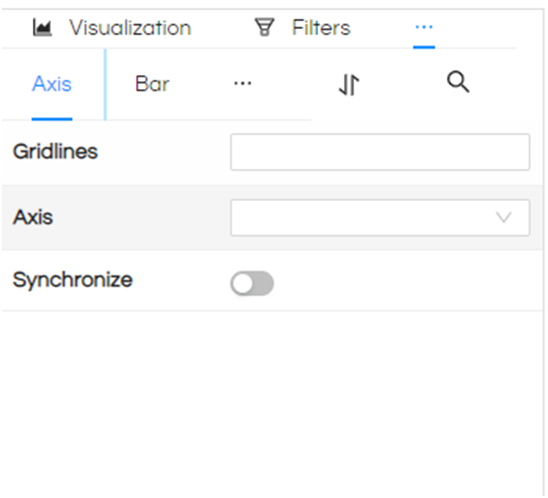
- Here if you select a numeric column in the Axis then you will get two options called ‘Max value’ and ‘Min value’
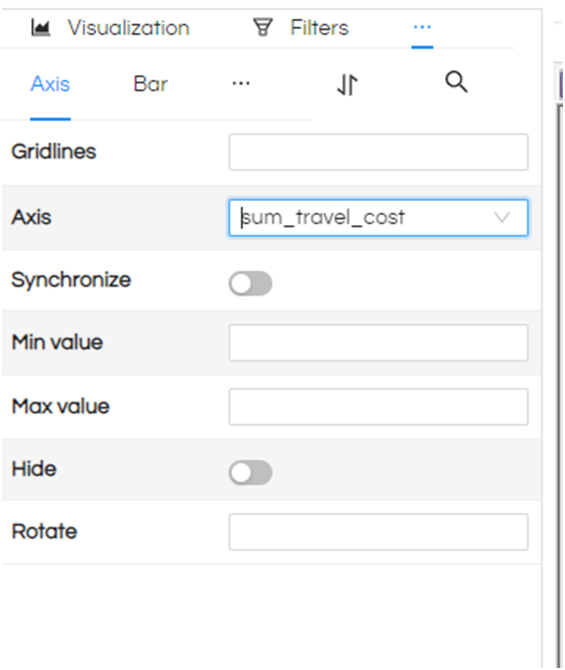
In this fields you can define the range you want to the axis to be in between.
After making changes click on Apply button.
Thank you,
Helical Insight.
