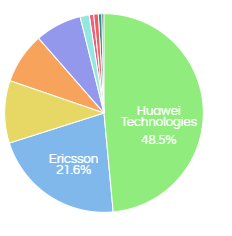
Hello Gaboro,
In order to show the labels along with the values, use the below script in JS Editor pane:
hi_container.set("preExecution", function(a) {

    var b = a.get("viz_Options");

    b.chartOptions.donut = {

width: 150,

        label: {

            show: true,

threshold: 0.1,

            format: function(a, b, c) {

                return c +"\n"+(b*100).toFixed(1)+'%';

            }

        }

    };

b.chartOptions.onrendered =  function (d, i) {

var id = hi_container.get("renderId");

function wrapText(text, width) {

        text.each(function () {

            var textEl = d3.select(this),

                words = textEl.text().split(/\s+/).reverse(),

                word,

                line = [],

                linenumber = 0,

                lineHeight = 0.5, // ems

                y = textEl.attr('y'),

                dx = parseFloat(textEl.attr('dx') || 0),

                dy = parseFloat(textEl.attr('dy') || 0),

                tspan = textEl.text(null).append('tspan').attr('x', 0).attr('y', y).attr('dy', dy + 'em');

            while (word = words.pop()) {

                line.push(word);

                tspan.text(line.join(' '));

                if (tspan.node().getComputedTextLength() > width || word.includes("%") ) {

                    line.pop();

                    tspan.text(line.join(' '));

                    line = [word];

                    tspan = textEl.append('tspan').attr('x', 0).attr('y', y).attr('dx', dx).attr('dy', ++linenumber * lineHeight + dy + 'em').text(word);

                }

            }

        });

    }

function fixlabels(text) {

        text.each(function () {

            var label = d3.select(this),

labelNode = label.node();

if (labelNode) {

label.attr("transform", function(d,i){

var r = 75,

        a = (d.startAngle + d.endAngle) / 2 - (Math.PI / 2);

    return "translate(" + (Math.cos(a) * r) + "," + (Math.sin(a) * r) + ")";

  });

            }

        });

    }

d3.selectAll("#chart-"+id +" .c3-chart-arc.c3-target > text").call(wrapText, 100);

d3.selectAll("#chart-"+id +" .c3-chart-arc.c3-target > text").call(fixlabels);

}

a.set("viz_Options", b);

});

Thank You
From Team Helical Insight

