Hello,
I want to create percentage bar chart with labels. I am using Helical Insight version 5.2 EE.

Hello,
I want to create percentage bar chart with labels. I am using Helical Insight version 5.2 EE.
Hello,
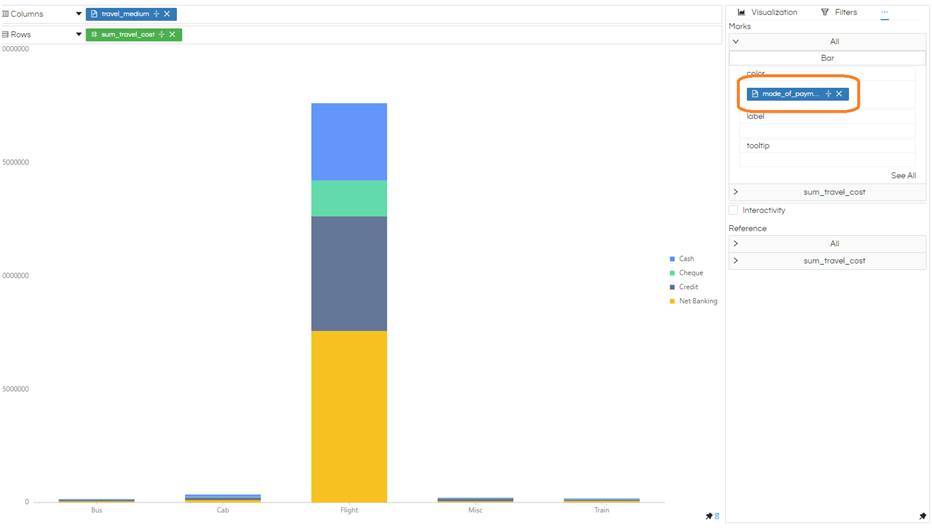
Step 1 :
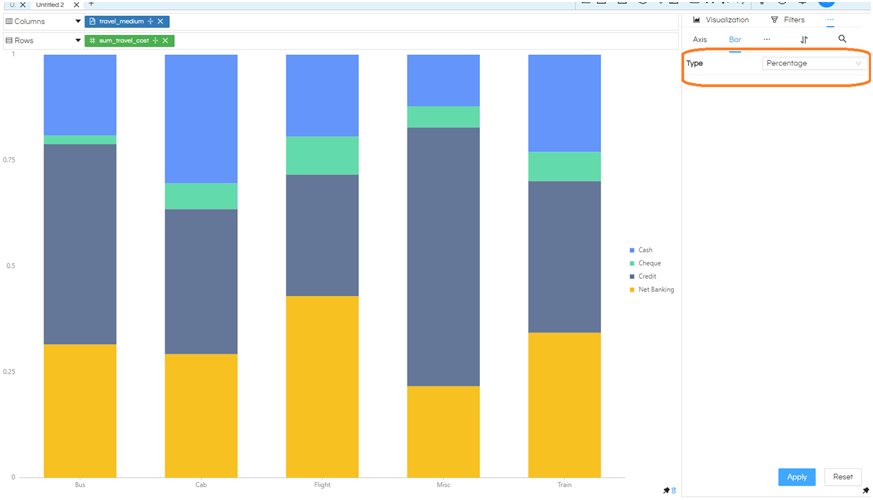
Step2 : Configure Bar Properties
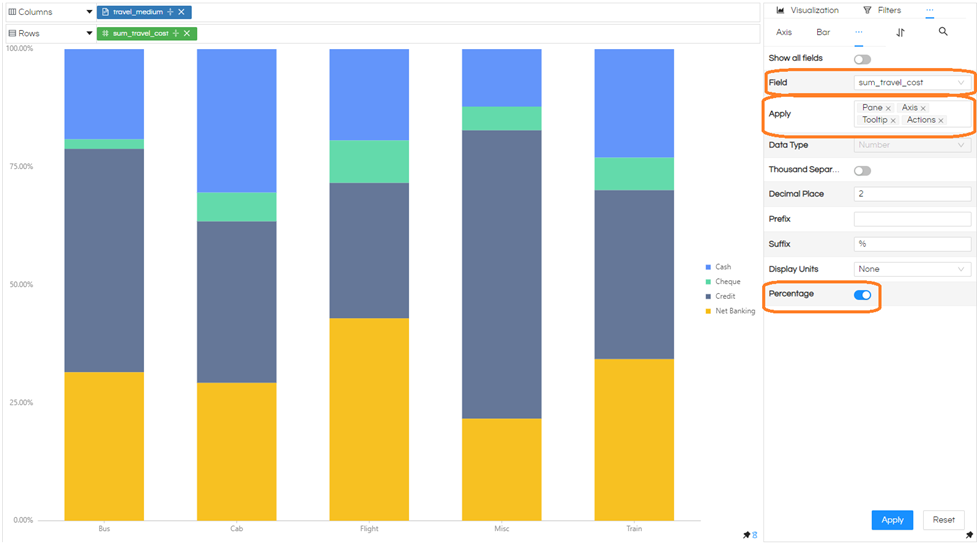
Step 3 : Format the Chart
In the properties, select the format option.
Follow these points:
Select the measure field in the field dropdown (e.g., sum_travel_cost).
Toggle the percentage option on.
Apply this setting to Pane, Axis, Tooltip, and Actions.
Click “Apply.”
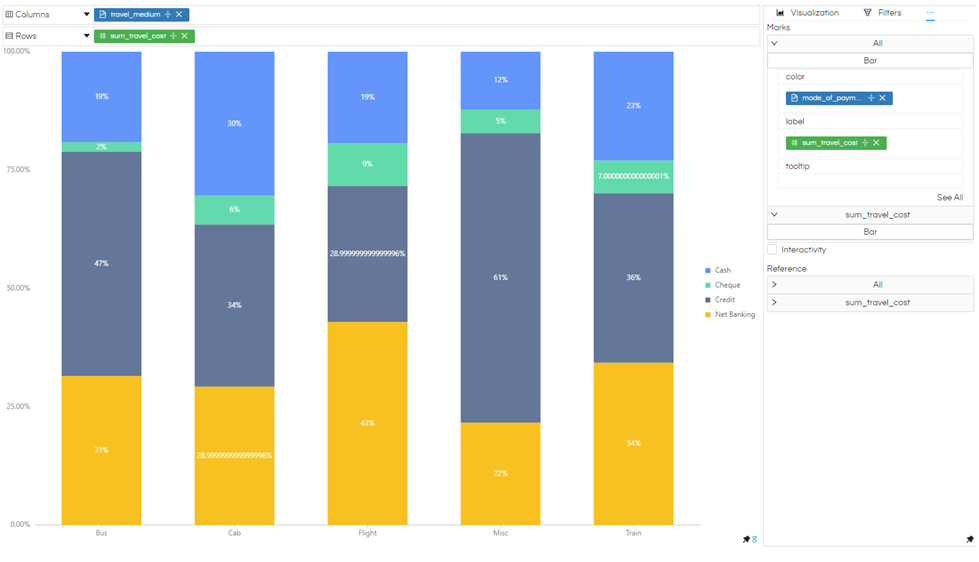
Step 4 :
Drag the measure field to the label field in the marks and generate the chart.
By following these steps, you will observe that the bar chart now displays percentages.
Thank You.