Hello Team,
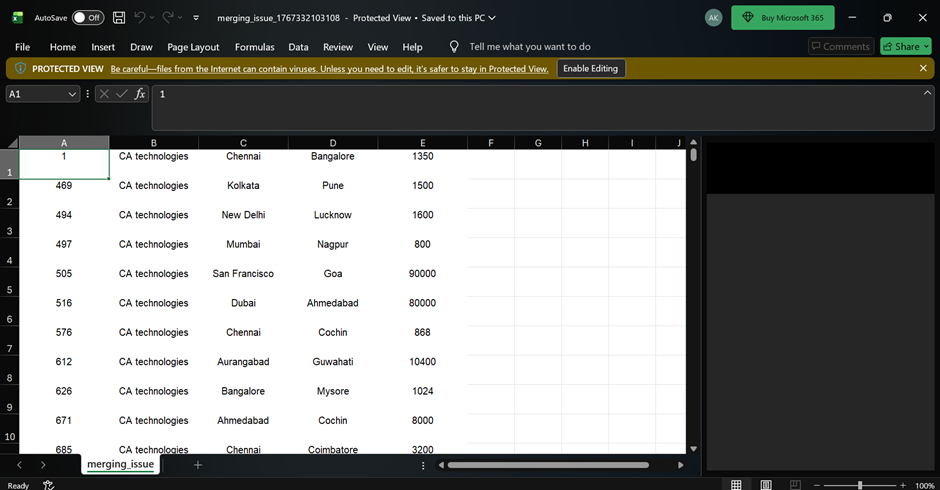
I am using open source BI Helical insight version 6.0 canned report. I have created a report. However when exported in excel, the columns are merging. You can see the below image where cells A and B are merged.

Hello Team,
I am using open source BI Helical insight version 6.0 canned report. I have created a report. However when exported in excel, the columns are merging. You can see the below image where cells A and B are merged.
In the canned report designer:
Each column is positioned using an X-coordinate (horizontal start position).
Each column also has a defined width.
Excel relies on these values to determine where one column ends and the next begins.
If the X value of a column overlaps with the previous column’s width, Excel interprets this as overlapping cells and automatically merges them.
So, to fix this issue, check the width and X position of the text fields in the canned report.
For the “NAME” column, the starting X position is 100, and the cell width is set to 100.
This means the NAME column occupies space from X = 100 to X = 200 in the report layout.

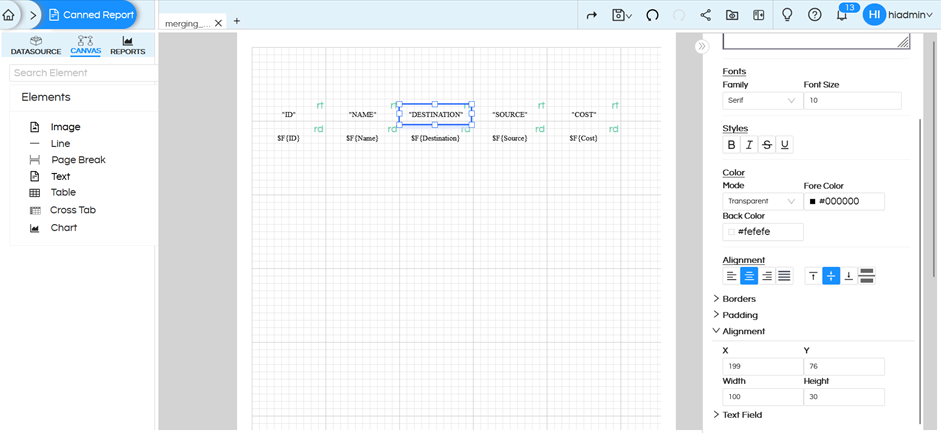
Also check the “DESTINATION” column, which appears as Cell C in the Excel file.
This column was starting at X = 199 and had a width of 100.
Because the DESTINATION column started at X = 199, it overlapped with the previous NAME column, which caused the cell merging issue in Excel.
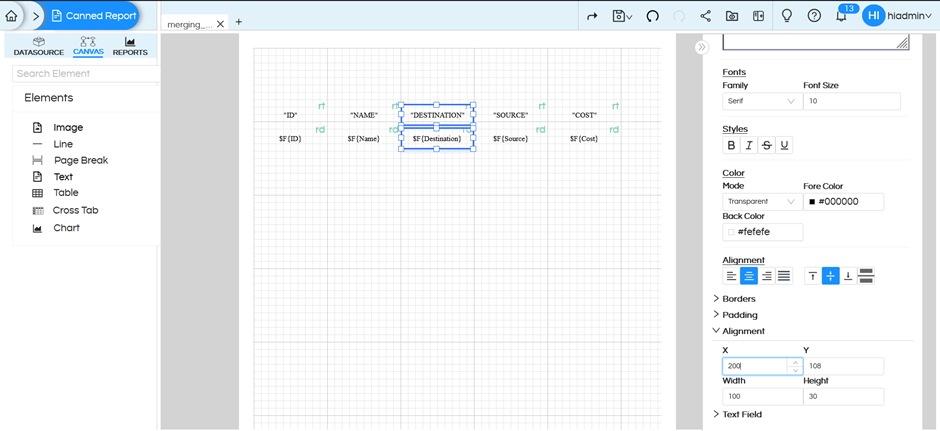
The DESTINATION column should start at X = 200, because the NAME column starts at X = 100 and has a width of 100.
So, the next column’s X position must be 200, which is the sum of the previous column’s width.
After identifying this issue, update the X position of the “DESTINATION” column to 200.
Please refer to the below image for the updated configuration.
Then, save the report and export in XLSX format.
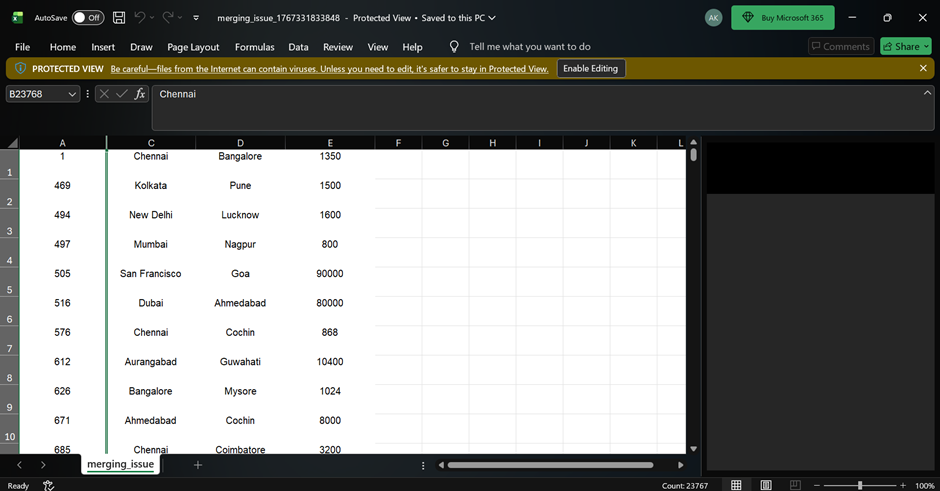
After exporting, verify the Excel file. You can see that the cell merging issue is fixed.
Please check the below image for reference.