Negative Y axis Origin

Hello Helical Insight,

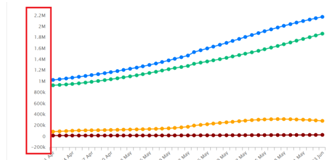
I am using Helical Insight 4.0. I have created a line chart. I have data which is close to 0, but not 0 or below 0. However, I am getting Y axis origin at -200k. Can you help to fix this so that the Y axis range starts from 0?

image

Thank You,
Jam.

Hello Jam,

This can be achieved with the help of a JS script. Open the report in edit mode and put the below JScode in the JS editor.

Paste the following script in the JS Editor:

hi_container.set("preExecution",function(c){
var viz_Options = c.get("viz_Options");
viz_Options.chartOptions.axis =
{
y: {
// max: 400,
min: 0,
// Range includes padding, set 0 if no padding needed
padding: {top:0, bottom:0}
}
};
c.set("viz_Options",viz_Options);
});

Thank You,
Helical Insight.