Hello Helical,
I am using Helical Insight 4.0. I want to make a chart with multiple lines as shown below:
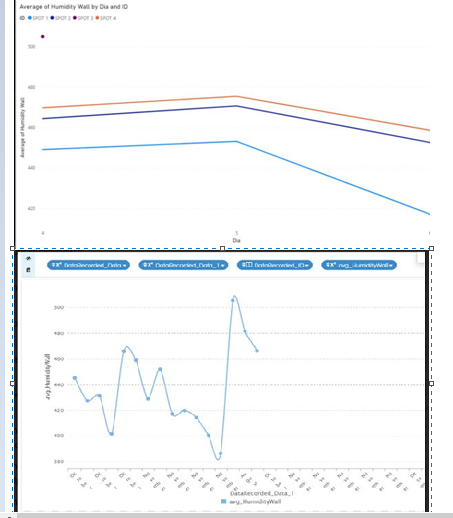
When I try to create a line chart in Helical Insight, it looks like above.
Can you help to create the report?
Thanks,
Snow.

Hello Helical,
I am using Helical Insight 4.0. I want to make a chart with multiple lines as shown below:
When I try to create a line chart in Helical Insight, it looks like above.
Can you help to create the report?
Thanks,
Snow.
Hello Snow,
In the example image that you have shared of the report, there is no aggregate function applied on “DataRecorded_Data” and “DataRecorded_Data_1” columns. There is a GroupBy applied. Hence, the chart considers it as a dimension and not a measure.
Also, “DataRecorded_ID” column does not have any aggregate or group by function.
Below is the solution:
If you want to have Avg Humidity by ID, then apply “Group By” on “DataRecorded_ID” column.
Apply avg on humidity column (already done) and sum or count or any other aggregate function on “DataRecorded_Data” and “DataRecorded_Data_1” columns.
Generate the line chart. You will get 3 lines, one for each of the columns mentioned in step
Thanks,
Helical Insight.