Incorrect Bars Displayed for Null Values in Grid Chart Bar Chart

Hello,

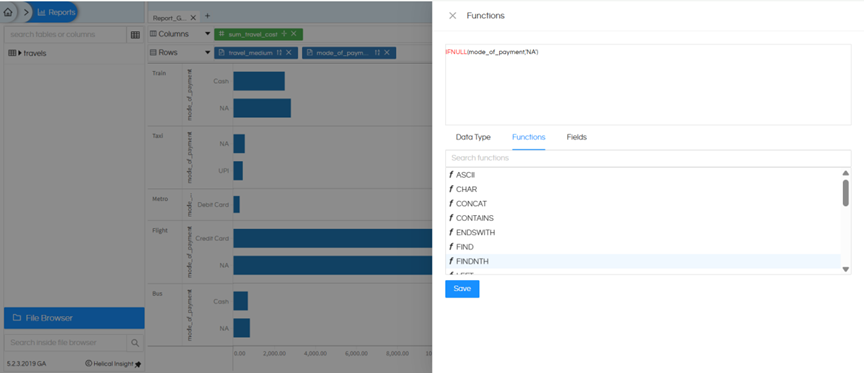
We are using the open-source BI tool Helical Insight version 5.2.3.2019 GA and have created a bar chart using the Grid Chart.

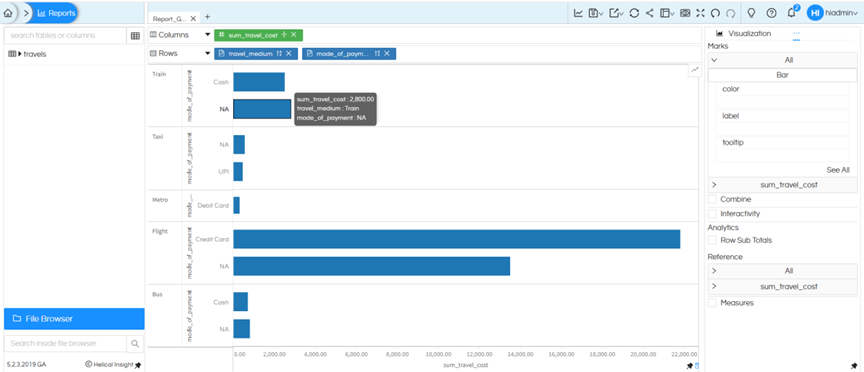
When the dataset contains NULL values, the bar chart displays incorrect bar lengths. Specifically, the bars corresponding to certain categories appear swapped or do not match the actual values from the dataset.

Other categories display correctly when NULL values are not present, but the issue occurs whenever NULL data exists in the dataset.

Has anyone encountered this issue? What is the correct way to fix it?

Hello,

Grid Chart does not support handling of NULL values properly, which leads to incorrect bar representation when NULL data is present.

Workaround :

The recommended approach is to apply a database function to replace NULL values with a default value (for example, ‘NA’ or ‘Others’)

Example :

IFNULL(mode_of_payment, ‘NA’)

After applying this transformation, the chart works correctly and displays the expected results.

image

image

Note:

If your use case allows using only a single dimension and a single measure, you can switch to the Chart component instead of Grid Chart, as it supports NULL values natively and handles them correctly.

Thank You,
Helical Insight