Hello Helical Insight Team,
I am using helical insight enterprise edition 5.1 GA. I would like to implement percentage in bar chart y axis. How to do that?

Hello Helical Insight Team,
I am using helical insight enterprise edition 5.1 GA. I would like to implement percentage in bar chart y axis. How to do that?
Hello,
To implement percentages in a bar chart, follow these steps:
Step 1 :
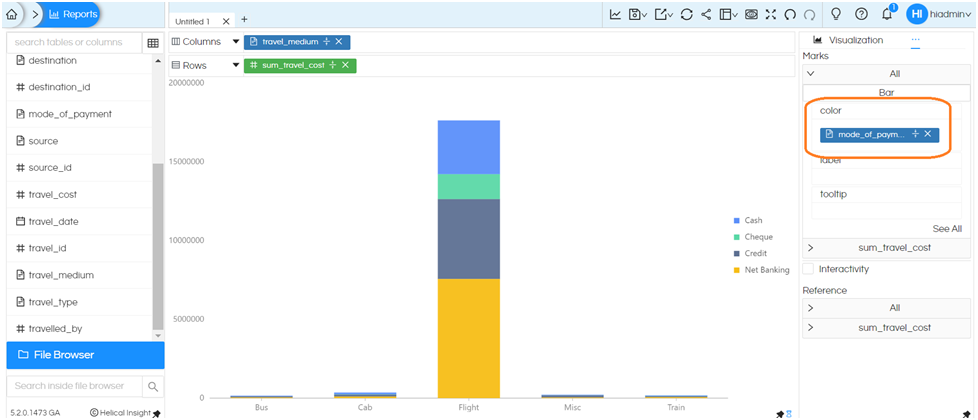
Step2 : Configure Bar Properties
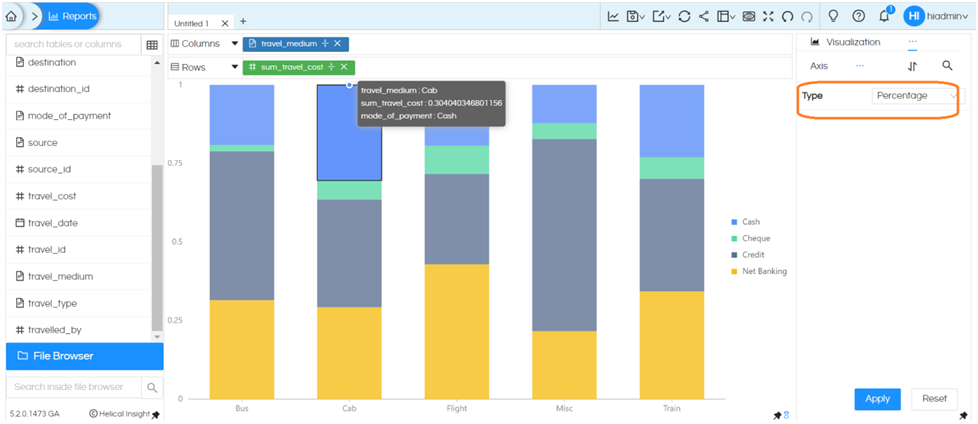
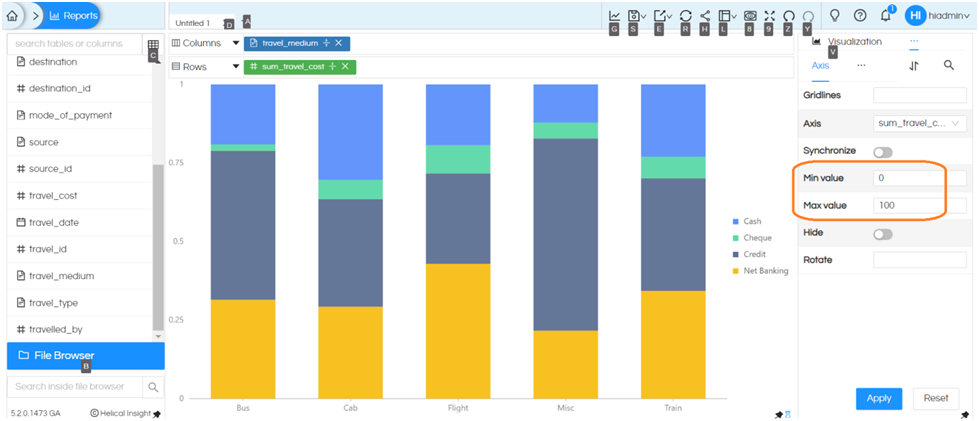
Step3 : Adjust Axis Properties
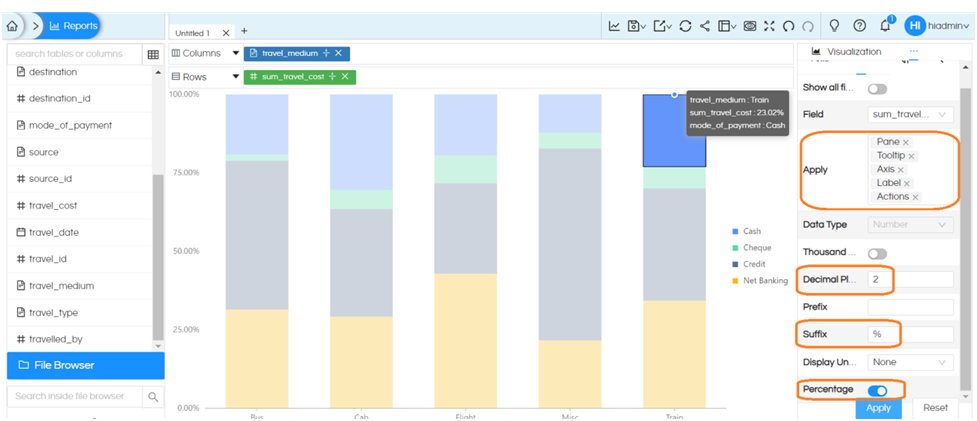
Step 4 : Format the Chart
In the properties, select the format option.
Follow these points:
Select the measure field in the field dropdown (e.g., sum_travel_cost).
Toggle the percentage option on.
Apply this setting to Pane, Axis, Tooltip, and Actions.
Click “Apply.”
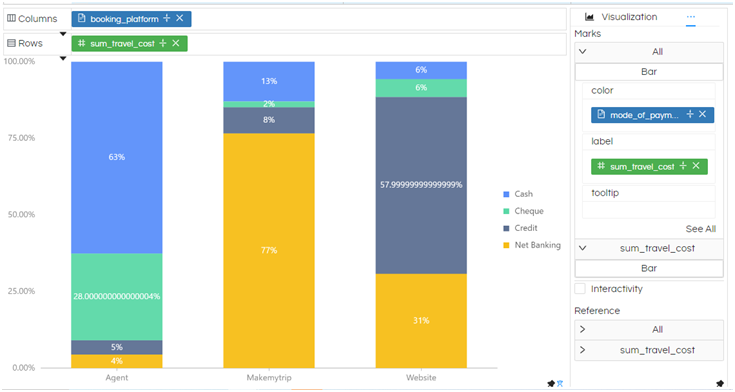
Step 5 :
Drag the measure field to the label field in the marks and generate the chart.
By following these steps, you will observe that the bar chart now displays percentages.
Thank you,
Helical Insight.