Hello Snow,
Yes, this can be achieved using the Grid Table visualization available in Helical Insight.
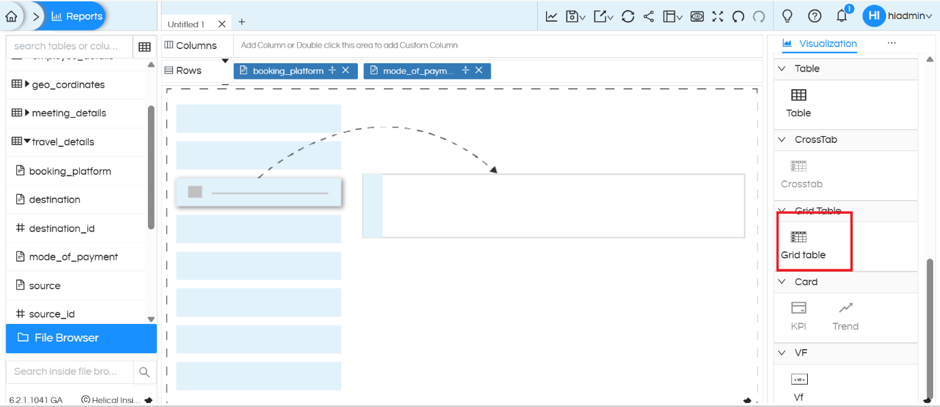
The Grid Table visualization supports creating a hierarchical, expandable/collapsible structure using dimensions and measures.
Follow these steps:
- Open the report designer and select the required dimensions from the data source.
- Drag the required dimensions into the Rows and columns section as per the design. Measures can also be used.
- Select the Grid Table visualization from the Visualization panel.
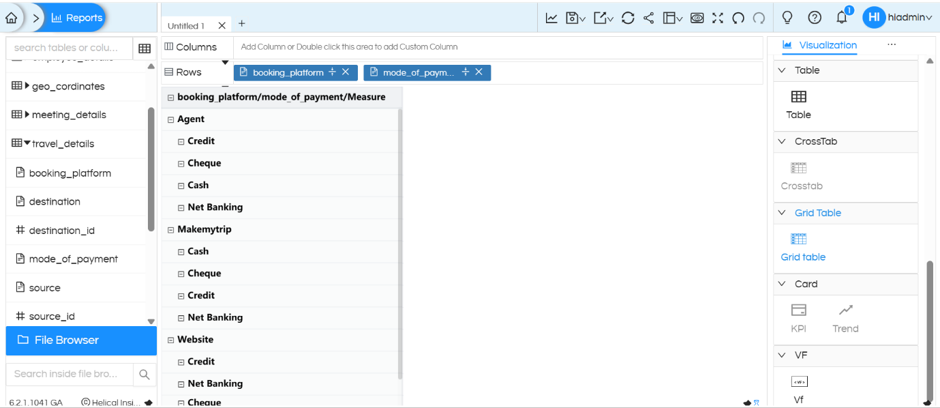
- The Grid Table will display the selected dimensions in a hierarchical structure, allowing users to expand or collapse the grouped values.
Example:
In this below example we have mulitple dimensions on rows, no measures and nothing in columns. You can use dimensions such as booking_platform and mode_of_payment to create a hierarchy, as shown in the screenshots below.
Thank You,
Helical Insight.
