Hello Helical Insight,
I am using Helical Insight 4.0. I need help in creating group bar chart in CE report. Please suggest the steps or share code snippet for the same.
Thank You,
Kaji.

Hello Helical Insight,
I am using Helical Insight 4.0. I need help in creating group bar chart in CE report. Please suggest the steps or share code snippet for the same.
Thank You,
Kaji.
Hello Kaji,
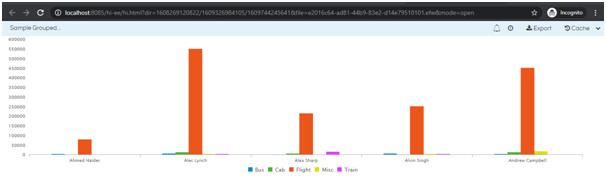
We have created a grouped barchart VF which you can use. Please download the attached file. Please note that the grouped bar chart with have 2 dimensions and 1 measure.
Grouped Bar.zip (1.1 KB)
Follow the below steps:
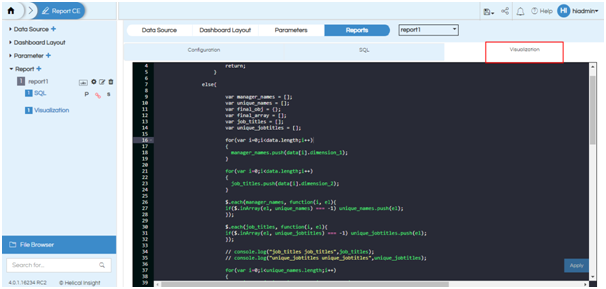
select
	"HIUSER"."employee_details"."employee_name" as "dimension_1",
 	"HIUSER"."travel_details"."travel_medium" as "dimension_2",
 	sum("HIUSER"."travel_details"."travel_cost") as "value"
from
	"HIUSER"."travel_details"
	inner join "HIUSER"."employee_details" on ("HIUSER"."employee_details"."employee_id" = "HIUSER"."travel_details"."travelled_by")
group by
	"HIUSER"."employee_details"."employee_name", "HIUSER"."travel_details"."travel_medium" FETCH FIRST 22 ROWS ONLY
Generate the chart.
Thank You,
Helical Insight.