Formatting minutes value on y-axis and tooltip label into HH:MM in Axis charts

Hello Helical Team,

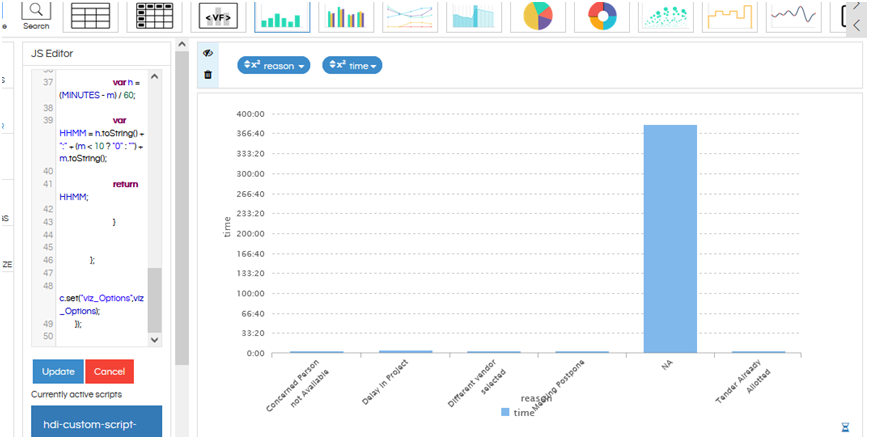
I am using helical insight enterprise edition 4.1. I have my data in a column which has numbers of mins. I would like to display that in chart but while displaying I would like to show it in this format HH:MM.

Is something like that possible?

Thank You,
Netta.

Hello Netta,

Yes that is possible. Below we have specified

  1. Open the report in edit mode

  2. Apply below script in js editor

            hi_container.set("preExecution",function(c){
              var viz_Options = c.get("viz_Options"); viz_Options.chartOptions.axis = {
     			 y : {
     				tick: {
     					format: function (d) {
    
     					var MINUTES = d;
    
     					var m = MINUTES % 60;
    
     					var h = (MINUTES - m) / 60;
    
     					var HHMM = h.toString() + ":" + (m < 10 ? "0" : "") + m.toString();
     					
     					return HHMM;
     					
     					}
     				}
     			},
     			
     			y2: {
     				show: true,
     				}
     		};
     		
     		 viz_Options.chartOptions.tooltip = {
     			
     				
     					format: function (d) {
    
     					var MINUTES = d;
    
     					var m = MINUTES % 60;
    
     					var h = (MINUTES - m) / 60;
    
     					var HHMM = h.toString() + ":" + (m < 10 ? "0" : "") + m.toString();
     					
     					return HHMM;
     					
     					}
     				
     			
     		};
     		
             c.set("viz_Options",viz_Options);
     });	
    
  3. Report with formatting y-axis and tooltip
    image

Thank You,
Helical Team.