Hello Lero,
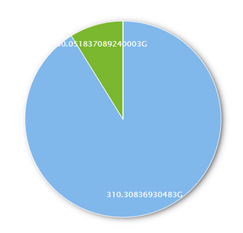
When you apply round on a particular column and then apply aggregate function on it, the round function is applied on the individual values but not on the overall value. The SQL generated will look like sum(round(column_name,2)) and not round(sum(column_name),2). This is why the above output is obtained. This is a known bug which we are working on fixing it.
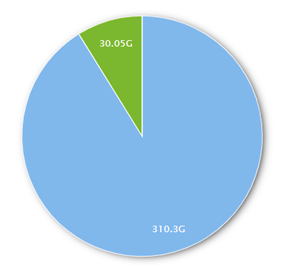
You can apply d3.format() function in the JS editor. The d3.format function is used to apply formatting to numbers in d3 charts. Here, we are using “.4s” which implies display 4 significant digits and “s” stands for scientific. That means it will display k for 1000, M for mega and G for giga.
You can find more options for formatting in the following link:
Following script will work for pie chart. Open the pie chart and add the below script in JS Editor of Editor section:
hi_container.set("preExecution",function(c)
{
	var viz_Options = c.get("viz_Options");
	viz_Options.chartOptions.pie =
		{
		label:
			{
			format: function(value, ratio, id)
				{
				return d3.format('.4s')(value);
				}
		    }
		};
	c.set("viz_Options",viz_Options);
});
Thank You
From Team Helical