Hello Helical,
I am using Helical Insight 4.0 and creating CE report. I want to implement drilldown from bar chart to a pie chart. What are the steps I need to follow?
Thank You,
Jam.

Hello Helical,
I am using Helical Insight 4.0 and creating CE report. I want to implement drilldown from bar chart to a pie chart. What are the steps I need to follow?
Thank You,
Jam.
Hello Jam,
In order to implement drill down in CE report we need to use custom visualization option
In order to write on click function.
Concept : we should write on click function for that specific chart in the visualization to get that clicked value and it should be set to a parameter. And then child report should listen to that parameter in order to filter the data based on the clicked value.
Below is a sample CE Dashboard to explain the drilldown.
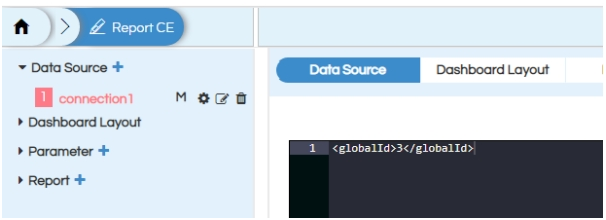
Create data source connection :
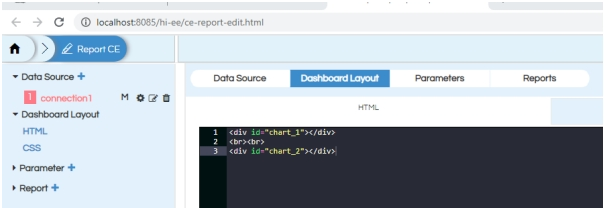
Creating divs for parent and child reports to render :
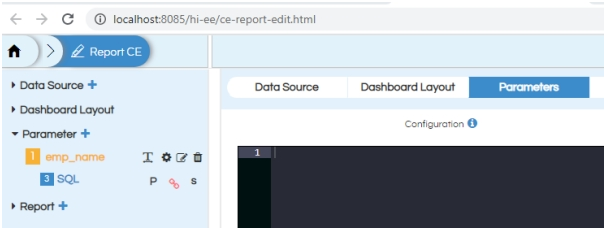
Create a parameter to set the drill down value , donot provide any configuration :
Report Configurations
A. Parent report configuration (Bar chart)
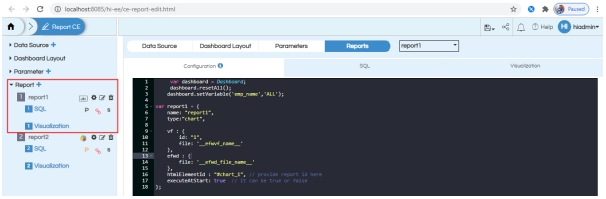
Configuration :
var dashboard = Dashboard;
     dashboard.resetAll();
//setting default value of Dashboard variable
	dashboard.setVariable('emp_name','ALL');

var report1 = {
    name: "report1",
    type:"chart",

    vf : {
        id: "1",
        file: '__efwvf_name__'
    },
    efwd : {
        file: '__efwd_file_name__'
    },
    htmlElementId : "#chart_1", // provide report id here
    executeAtStart: true  // it can be true or false
};
SQL :
select employee_name, age from employee_details limit 10
Visualization :
if (data.length == 0) {
					$('#chart_2').html("<div><h2 style='text-align:center;color:#927333;'>No Data To Display</h2></div>");
					  } else {
					var array1=[];
					for (var i = 0; i < data.length; i++) {
					var array2=[];

					for (var prop in data[i]) {

					array2.push(data[i][prop]);
					}
					array1[i] = array2;
					}
					var chart = c3.generate({
					bindto: '#chart_1',
					data: {
					columns: array1,
					type : 'bar',
//  here we write on click funtion to get clicked  value (dimension)of bar
					onclick: function(d,element) {
					//setting that value to Dashboard variable
					 dashboard.setVariable('emp_name',d.name);

					}
					},
					tooltip: {
					show: true
					 },
					 legend:{
					show: true
					 }
					});
					}
Child Report Configuration ( Pie chart)
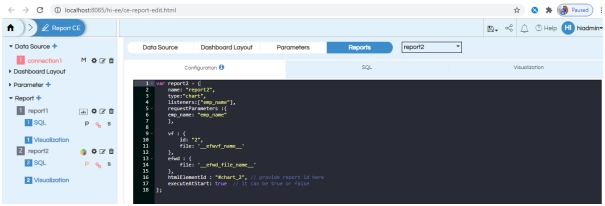
Configuration :
Here we need to provide listener and input parameters in the configuration and selected existing visualization from the list :
var report2 = {
    name: "report2",
    type:"chart",
    listeners:["emp_name"],
    requestParameters :{
    emp_name: "emp_name"
    },

    vf : {
        id: "2",
        file: '__efwvf_name__'
    },
    efwd : {
        file: '__efwd_file_name__'
    },
    htmlElementId : "#chart_2", // provide report id here
    executeAtStart: true  // it can be true or false
};
SQL :
Here we need to pass the parameter in the where clause to the child report query :
select employee_name, age from employee_details where employee_name= ${emp_name} or 'ALL'=${emp_name}
Visualization :
<Dimensions>employee_name</Dimensions>
<Measures>age</Measures>
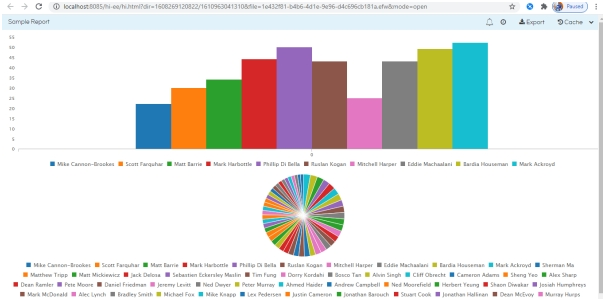
When we open Dashboard it appears as below :
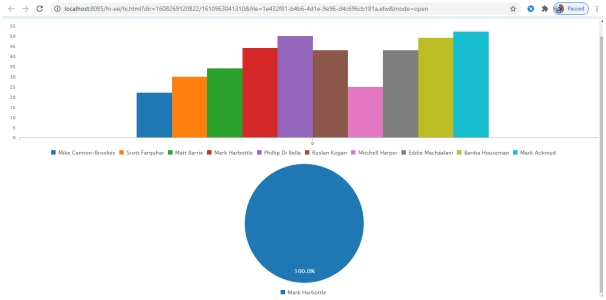
After clicking on any individual bar it opens as below :
Thank You,
Helical Insight.