Hello Netta,
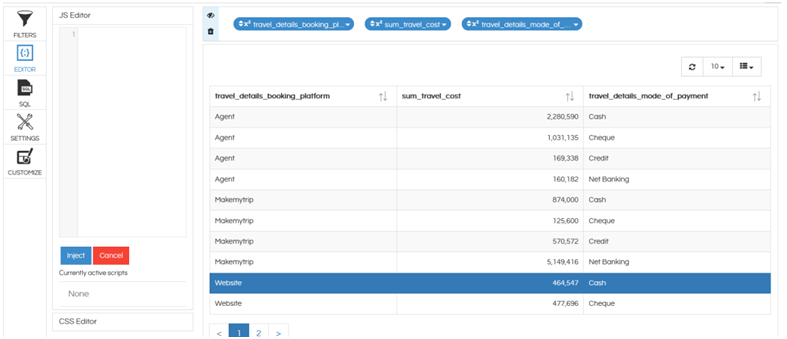
The arrows you see is the inbuilt property of the table visualization and we can disable it by changing the chart options by forcing those parameters to be turned off via JavaScript.
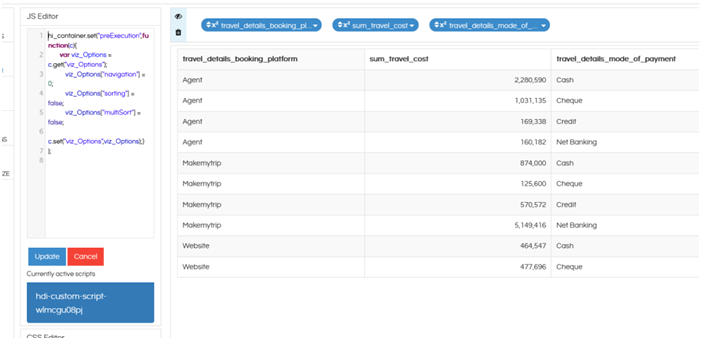
Use the following JavaScript code snippet in the JS Editor of the report to make that happen.
hi_container.set("preExecution",function(c){
		var viz_Options = c.get("viz_Options");
			viz_Options["navigation"] = 0;
			viz_Options["sorting"] = false;
			viz_Options["multiSort"] = false;
			c.set("viz_Options",viz_Options);}
);
Please note that disabling the arrows, will also disable the sorting feature for anyone who is viewing this report.
There are other options also present here in the JS code which you can see
Navigation : it can remove the navigation buttons at the bottom of the table (page 1 2 etc) as well as options at top right (like number of records, refresh, columns to be shown).
Sortin: it can be used to remove the sorting option which appears when we hover over the table
Multisort: It can allow to enable disable disable multiple sorting on multiple columns.
Without code

With code (navigation is removed at the top and bottom of report is gone as well as sorting option is gone)

Thank You,
Helical Insight.


