Data Labels in Custom Column

Hello Team HI,

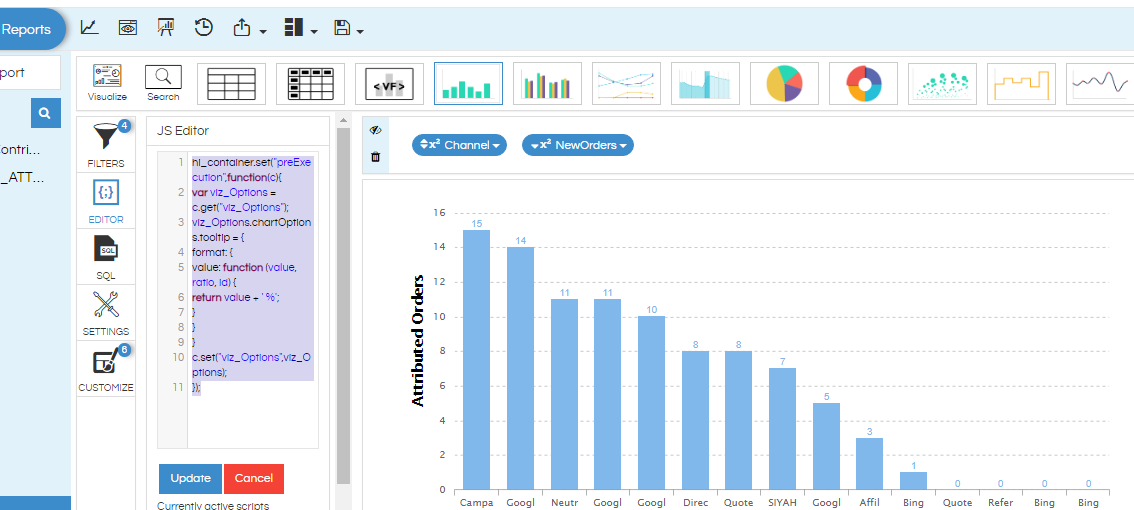
I am using Helical Insight Enterprise Edition 3.1. For doing certain kind of function i have used a custom column and displaying the data in a bar chart format.

However I would like to enable data column, but the UI driven chart customization is not showing the custom column as an option. Please help.

Thank You
Kevin.

1 Like

Hello Kevin,

You can handle that by using the below JS inside the editor. Open the adhoc report which you have created, add the below code in the JS portion of the editor. This will put the data labels in the custom column also. In a similar way you can also add more customizations as well.

hi_container.set("preExecution",function(c){

var viz_Options = c.get("viz_Options");

viz_Options.chartOptions.data = {
labels : {
customColumn: function(d) { //provide the correct name of the column here
return d.value == d.value;
}
}
};
c.set("viz_Options",viz_Options);
});

Thank You
Team Helical.