Hello Sesa,
You can achieve the above by adding external JS script.
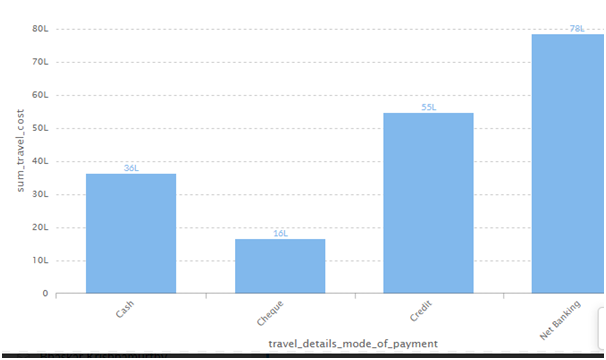
We use C3js axis charts. These charts have API for Y axis tick format. By default, the formatting is in K M etc.
We have written custom logic within the format function to achieve the formatting in thousands, lakhs and crores.
Please put the below script in the JS editor:
hi_container.set("preExecution",function(c){

var viz_Options = c.get("viz_Options");

viz_Options.chartOptions["axis"] = {

y:{

tick: {

format: function (d) {

if (d>=0 && d <= 999){

return d;

}

else if(d >= 1000 && d <= 99999){

return d/1000 + 'K';

}

else if(d >= 100000 && d <= 9999999){

return d/100000 + 'L';

}

else if (d >= 10000000){

return d/10000000 + 'C';

}

}

}

}

};

c.set("viz_Options",viz_Options);

});
Output:

Thank You,
Helical Insight.

