Hello helical insight,
I am using a scatter chart in Helical Insight 4.0. I want the size of the bubbles to change based on the value of the measure. How do I do this?
Thank you
Sesa

Hello helical insight,
I am using a scatter chart in Helical Insight 4.0. I want the size of the bubbles to change based on the value of the measure. How do I do this?
Thank you
Sesa
Hello sesa,
We have created a customization to adjust the bubble size based on the measure selected.
You can download this customization script: BubbleSizeCustomization.script
Place this script at the location \hi\hi-repository\System\Admin\CustomScripts\d3\js
Refresh the Report Create page.
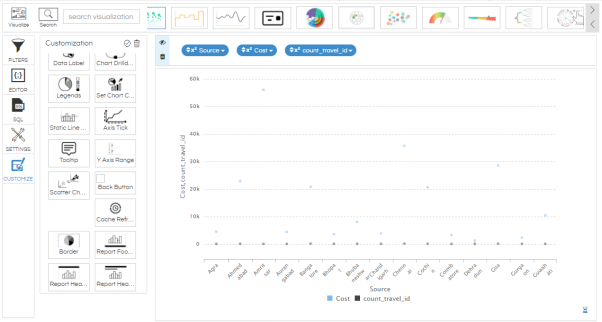
Select the dimension and the measures that you want to plot on the scatter chart and generate the chart. For each measure, you will see different colour scatters.
In the below example, we have selected Source as dimension and 2 measures – Sum(travelcost) and count(travelid).
Go to the customization tab. You will see Scatter Chart Custom Size script. Double click on it and the following popup will appear.
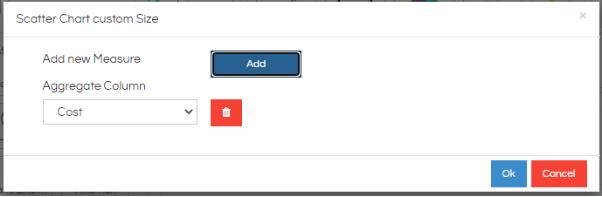
You can select the measure based on which the bubble size should change. We have selected sum(cost) as the dimension.
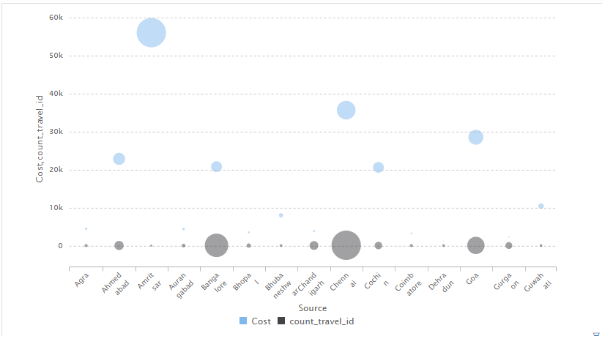
Apply the script. You will get the output in the following manner.
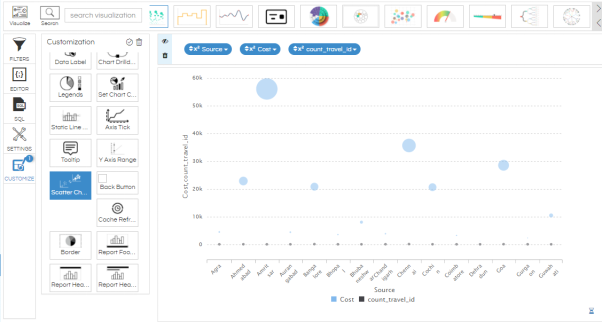
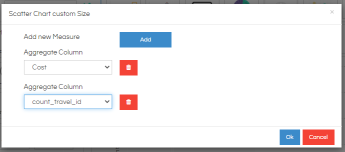
Since we have selected only one measure to vary the size, the bubble size of only the corresponding measure is changing. If we add both the measures, size will vary for both the scatters.
Thank You
From Team Helical