Hello Team,
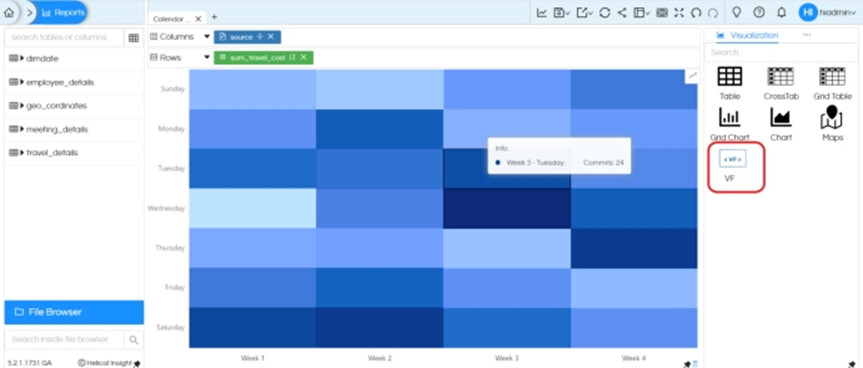
I am using Helical Insight 5.2.1. Can I create a calendar heatmap report in Helical Insight Enterprise edition?

Hello Team,
I am using Helical Insight 5.2.1. Can I create a calendar heatmap report in Helical Insight Enterprise edition?
Hello Netta,
By default right now we do not support calendar chart. However we do have an option to extend the capabilities and integrate any external chart. Below we have provided the code which you can put in when you click on VF. In a similar way any other AntD chart can also be integrated and used within Helical Insight application.
We are providing VF code for the reference.
function DrawHeatMapCalendar() {
const { Heatmap } = components;
const data = [
    { date: '2014-09-01', week: 'Week 1', day: 'Monday', commits: 15 },
    { date: '2014-09-02', week: 'Week 1', day: 'Tuesday', commits: 20 },
    { date: '2014-09-03', week: 'Week 1', day: 'Wednesday', commits: 5 },
    { date: '2014-09-04', week: 'Week 1', day: 'Thursday', commits: 12 },
    { date: '2014-09-05', week: 'Week 1', day: 'Friday', commits: 18 },
    { date: '2014-09-06', week: 'Week 1', day: 'Saturday', commits: 25 },
    { date: '2014-09-07', week: 'Week 1', day: 'Sunday', commits: 10 },
    { date: '2014-09-08', week: 'Week 2', day: 'Monday', commits: 22 },
    { date: '2014-09-09', week: 'Week 2', day: 'Tuesday', commits: 19 },
    { date: '2014-09-10', week: 'Week 2', day: 'Wednesday', commits: 17 },
    { date: '2014-09-11', week: 'Week 2', day: 'Thursday', commits: 13 },
    { date: '2014-09-12', week: 'Week 2', day: 'Friday', commits: 21 },
    { date: '2014-09-13', week: 'Week 2', day: 'Saturday', commits: 27 },
    { date: '2014-09-14', week: 'Week 2', day: 'Sunday', commits: 8 },
    { date: '2014-09-15', week: 'Week 3', day: 'Monday', commits: 11 },
    { date: '2014-09-16', week: 'Week 3', day: 'Tuesday', commits: 24 },
    { date: '2014-09-17', week: 'Week 3', day: 'Wednesday', commits: 30 },
    { date: '2014-09-18', week: 'Week 3', day: 'Thursday', commits: 9 },
    { date: '2014-09-19', week: 'Week 3', day: 'Friday', commits: 15 },
    { date: '2014-09-20', week: 'Week 3', day: 'Saturday', commits: 20 },
    { date: '2014-09-21', week: 'Week 3', day: 'Sunday', commits: 14 },
    { date: '2014-09-22', week: 'Week 4', day: 'Monday', commits: 14 },
    { date: '2014-09-23', week: 'Week 4', day: 'Tuesday', commits: 16 },
    { date: '2014-09-24', week: 'Week 4', day: 'Wednesday', commits: 22 },
    { date: '2014-09-25', week: 'Week 4', day: 'Thursday', commits: 27 },
    { date: '2014-09-26', week: 'Week 4', day: 'Friday', commits: 10 },
    { date: '2014-09-27', week: 'Week 4', day: 'Saturday', commits: 15 },
    { date: '2014-09-28', week: 'Week 4', day: 'Sunday', commits: 18 },
];

const config = {
    data,
    height: 400,
    autoFit: true,
    xField: 'week',
    yField: 'day',
    colorField: 'commits',
    reflect: 'y',
    meta: {
        day: {
            type: 'cat',
            values: ['Sunday', 'Monday', 'Tuesday', 'Wednesday', 'Thursday', 'Friday', 'Saturday'],
        },
        week: {
            type: 'cat',
        },
        commits: {
            sync: true,
        },
    },
    yAxis: {
        grid: null,
    },
    tooltip: {
        title: ' Info',  // General info in the title
        formatter: (datum) => {
            return {
                name: datum.week + ' - ' + datum.day,
                value: `Commits: ${datum.commits}`,  // Show date in the tooltip
            };
        },
        showMarkers: false,
    },
    interactions: [
        {
            type: 'element-active',
        },
    ],
    xAxis: {
        position: 'top',
        tickLine: null,
        line: null,
        label: {
            offset: 12,
            style: {
                fontSize: 12,
                fill: '#666',
                textBaseline: 'top',
            },
        },
    },
};

return <Heatmap {...config} />};

In order to dynamically use the selected columns data, we should use const data=data;
In data variable , it stores all the report data in json array format(it is a inbuilt variable)
Respective column names configuration should be given.
 xField: 'week',
  yField: 'day',
  colorField: 'commits',
Note : The Calendar Heatmap in Ant Design Charts expects data in a specific format to generate the chart. The data should typically have the following structure:
Date: The key representing the date (in the format of YYYY-MM-DD).
Value: A numerical value that will represent the intensity or magnitude of the heatmap on that date.
Thank You,
Helical Insight.