background color values in table based on certain conditions

Hello,

I am using Helical Insight 5.2.1. I have a requirement to change the background color of table cells based on certain conditions(condition formatting). I understand that the Color property is having background color but I want to define ranges and for that range of values what should be the color.

How can this be achieved?

Example: If a row value is above 10,000, display it in red; otherwise, use green

Yes, It it can be done using JavaScript.

Step1 : Open the tabular report in edit mode.
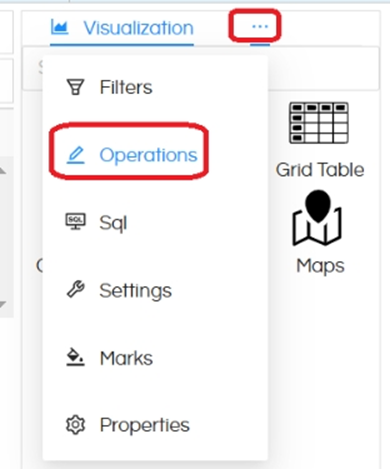
Step2 : Go to Operations>Post Execution

image

Inject below JS code :


let el = document.querySelectorAll('.hreport-table table tbody tr');
let index = 0;
el.forEach((item) =>{
if(index !== 0){
let row = item.querySelectorAll('td:nth-child(2)') // 2 is column index number(starts from 1) please define your column position here on which you want to define condition
let reqText = row[0].querySelector('div')
if(reqText.textContent >= 10000){  // define the condition
row[0].style.setProperty('background-color', 'red', 'important');
}else{
row[0].style.setProperty('background-color', 'green', 'important');
}
}
index ++;
})

image

Step 3: Click on ‘Apply’ and save the report

Hello,
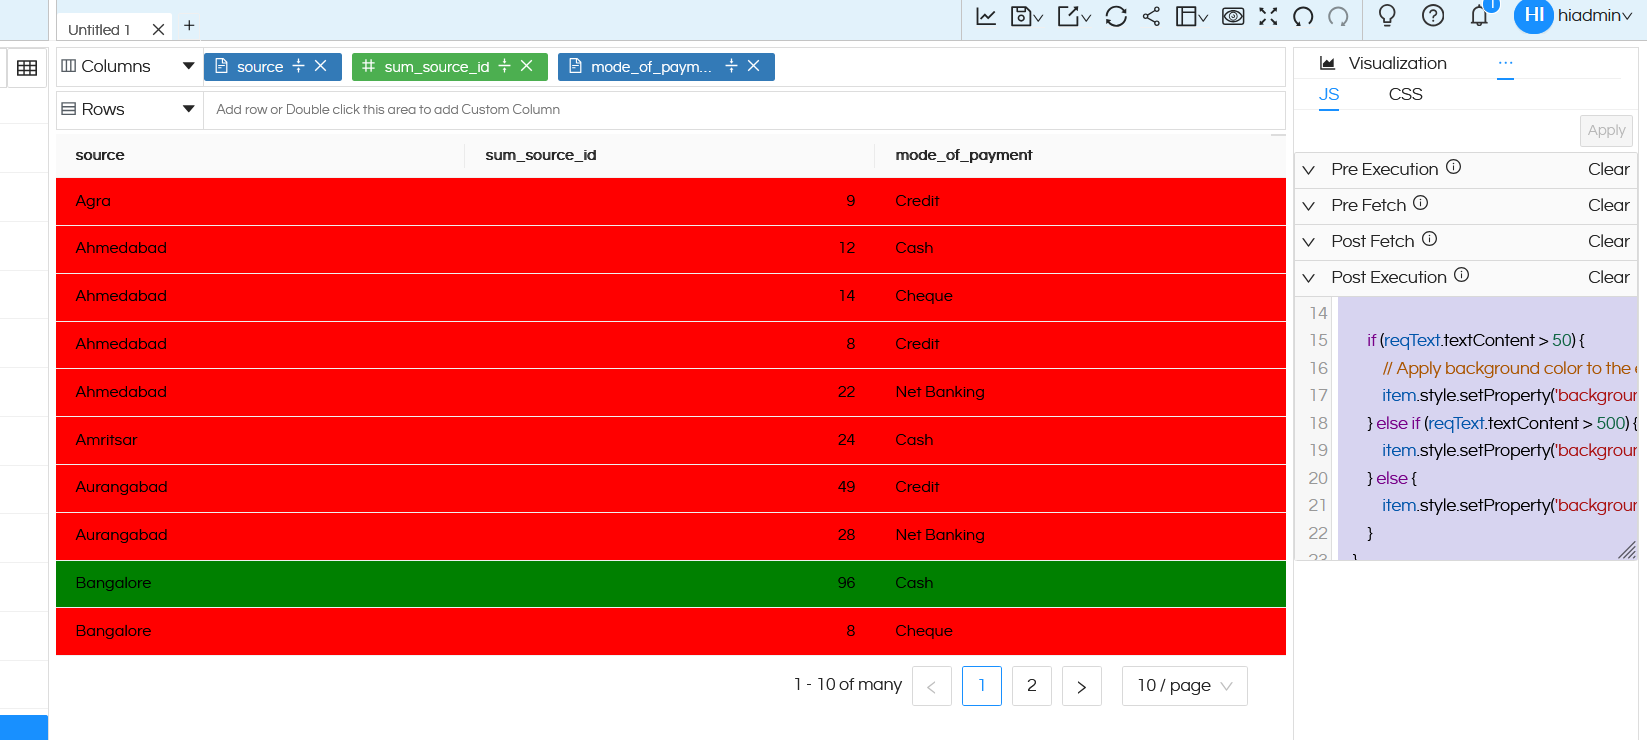
If we want that based on the value we would like all the columns to get affected, we can put below code in Post Execution

let el = document.querySelectorAll(’.hreport-table table tbody tr’);

console.log(el);

let index = 0;

el.forEach((item) => {

if (index !== 0) {
    let row = item.querySelectorAll('td:nth-child(2)'); // Target the second column
    console.log(row, 'row');

    let reqText = row[0].querySelector('div');

    if (reqText.textContent > 50) {
        // Apply background color to the entire row
        item.style.setProperty('background-color', 'green', 'important');
    } else if (reqText.textContent > 500) {
        item.style.setProperty('background-color', 'gray', 'important');
    } else {
        item.style.setProperty('background-color', 'red', 'important');
    }
}

index++;

});

image

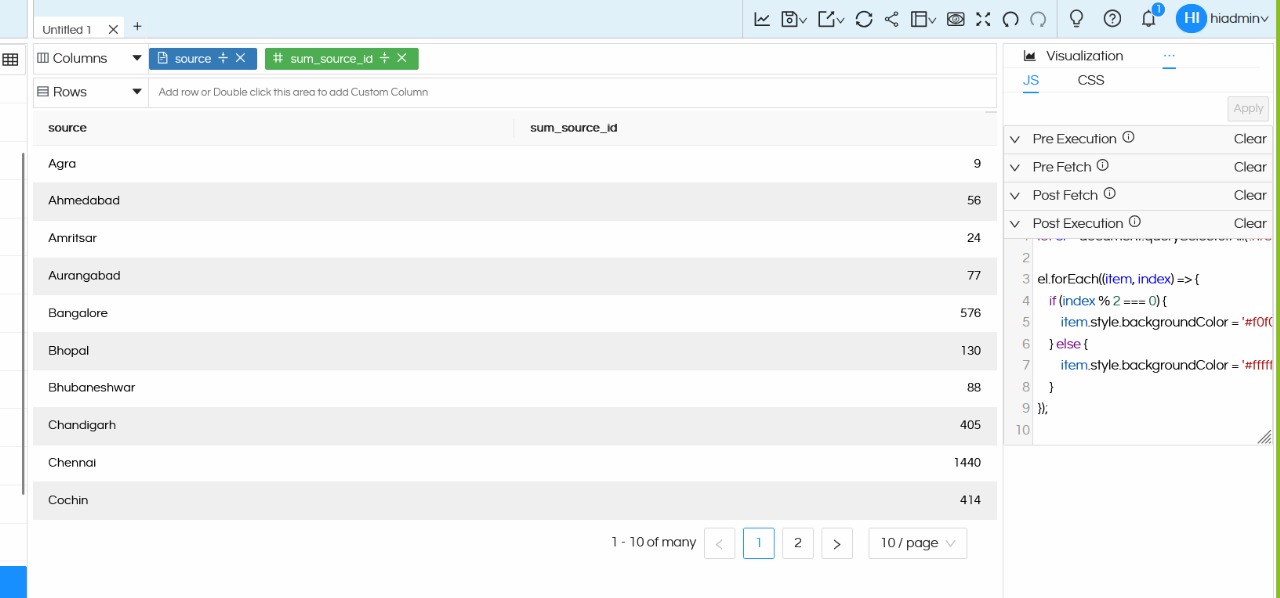
In case if you are looking for row banding (every alternate row of different color i.e. even rows background of different color, odd rows background of different colors) in version 5 onwards of Open source BI Helical Insight, then below code has to be used in the post execution of Operations of Adhoc HReport designer. Row banding helps in making the tabular report easily readable.

let el = document.querySelectorAll(’.hreport-table table tbody tr’);

el.forEach((item, index) => {
if (index % 2 === 0) {
item.style.backgroundColor = ‘#f0f0f0’; // Gray background for even rows
} else {
item.style.backgroundColor = ‘#ffffff’; // White background for odd rows
}
});

WhatsApp Image 2024-12-24 at 16.57.52_e160c0a8