Hello Netta,
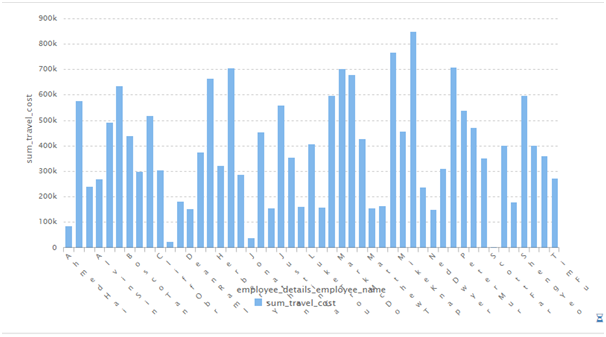
This is the default behaviour of all axis charts. When the number of data points increases, it becomes difficult to read all the values on the X axis as there might be overlap. In order to avoid this issue, by default, we enable “culling”. Culling implies that certain values on the X axis shall not be visible. This pattern depends on the number of data points.
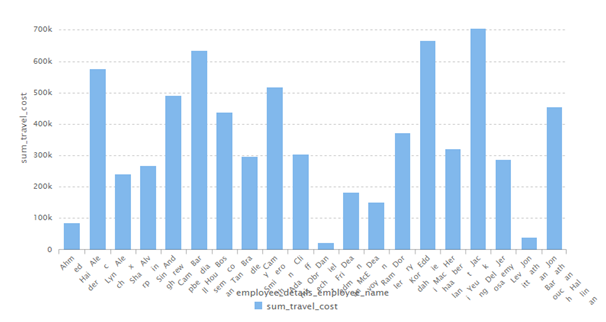
If you wish to display the values all the data points on the X axis and disable culling, use the following script in the JS Editor of your report. However please note that this can affect the readability on the X axis.
hi_container.set("preExecution",function(c)
{
	var viz_Options = c.get("viz_Options");
	viz_Options.chartOptions["axis"] =
	{
		x:
		{
			tick:
				{
				 culling: false
				}
		}
	};
	c.set("viz_Options",viz_Options);
});
Thank You,
Helical Insight.