Hello Sesa,
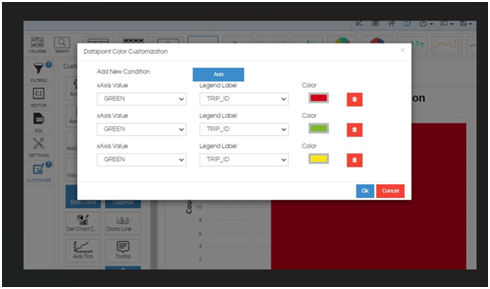
Generally your data is having 3 bars and when the data is having all 3 the colors are appearing fine. But in cases wherein less than 3 bars are present the sequence of color is getting changed.
We are providing a workaround below for now. Open the report in edit mode, remove the customization which you have applied. Then use the below code .
var barcolor = ['#faa811','#14aef3','#e43f43', '#0ad287','#ff44a1'];

hi_container.set("preExecution",function(c){

var viz_Options = c.get("viz_Options");

viz_Options.chartOptions.data = {
colors:{
**NAME_OF_COLUMN**: function(d) {
return d.value == d.value ? barcolor[d.x] : 'black';
}
}
};
c.set("viz_Options",viz_Options);
});
NOTE : In above script we highlighted 2 things. array which has list of bar chart colors, mention your own colors in hex code comma seperated here. NAME_OF_COLUMN will be your column name which has those different data points (Same name the way it is appearing in Helical insight front end). Please apply this and let us know if you have any further questions.
Thanks,
Helical Insight.

