Hello Team,
I am using Helical Insight 4.0. I want to add colors to my tabular report row based on a condition like if mode of payment is Cash – display color: red ; Cheque – display color :black etc…How can I do this?
Thank you!

Hello Team,
I am using Helical Insight 4.0. I want to add colors to my tabular report row based on a condition like if mode of payment is Cash – display color: red ; Cheque – display color :black etc…How can I do this?
Thank you!
Hello,
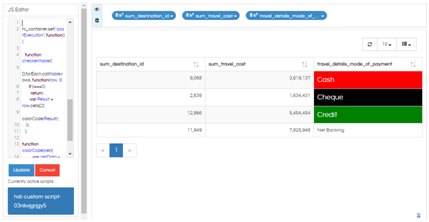
In this case to give column based coloring you can add the below code in JS editor and apply it.
CODE :
hi_container.set("postExecution", function(){
	 function checker(table){
	 [].forEach.call(table.rows, function(row, i){
	 if (i===0)
	 return;
	 var Result = row.cells[2]
	 colorCode(Result);
	 });
	 };
	 function colorCode(cell){
	 var cellData = cell.innerHTML.replace(/,/g , "");
	 console.log(cellData)
	 if(cellData == 'Cash') {
	 cell.style.backgroundColor = 'red';
	 cell.style.color = 'white';
	 cell.style.fontSize = 18;
	 }
	 if(cellData == 'Cheque') {
	 cell.style.backgroundColor = 'Black';
	 cell.style.color = 'white';
	 cell.style.fontSize = 18;
	 }
	 if(cellData == 'Credit') {
	 cell.style.backgroundColor = 'green';
	 cell.style.color = 'blue';
	 cell.style.fontSize = 18;
	 }
	 };
	 var table = document.querySelectorAll(".table");
 [].forEach.call(table, checker); });
In the above code you can specify the row num where this coloring should be applied…and give the condition accordingly.
Thank you for reaching out to us!