Hello Harika,
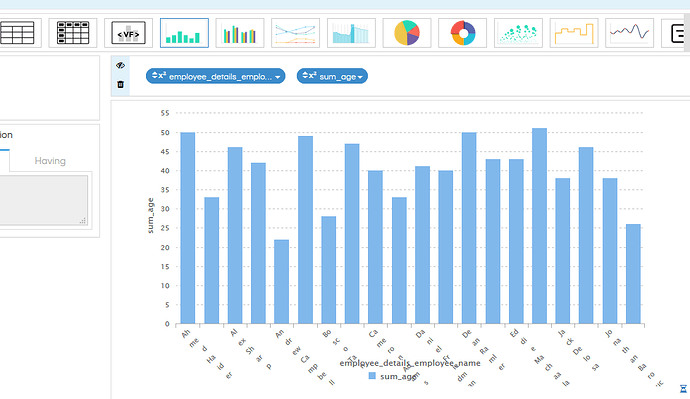
Generally the charts are very intelligence. Based on the amount of screen space which is available it automatically shows only limited X axis ticks so that it does not look cluttered.
However if you would still like to show all of them, you can download this TickCulling.zip (1.2 KB) zip file, extract it.
The extracted file needs to be on the location
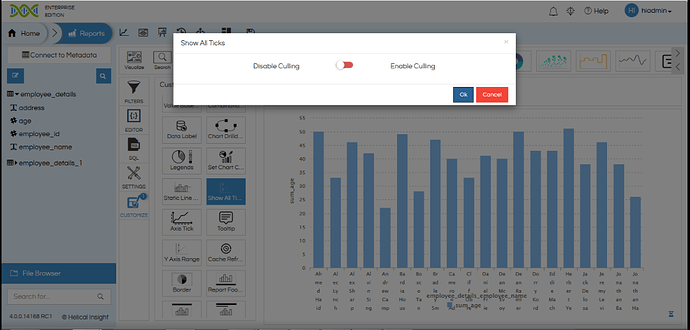
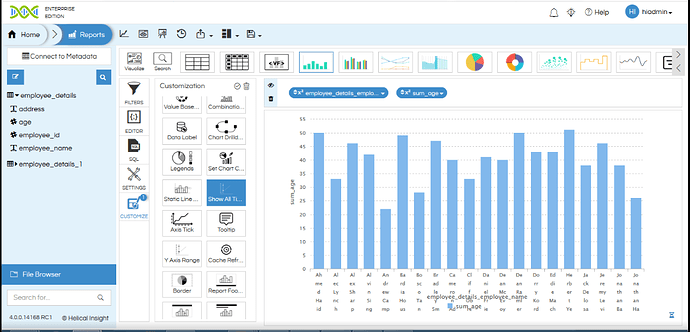
“…\hi\hi-repository\System\Admin\CustomScripts\c3Axis\js” Then create a report in private window, there in the “Customization” place you will see one more script option called “Show all ticks”. You can double click on that, in the popup box disable the culling and then click on “Apply”.
Then all the names will be visible.
Thank You
Team Helical


