How to create a pie chart?

Hi ! I am trying to create some charts to see if It’s easy as it seems.
However, I do not know how to create a pie chart.
I can display a column of my database (local mariadb) as an array.
I work in telecommunications, so I need to have views on some voice calls metrics :


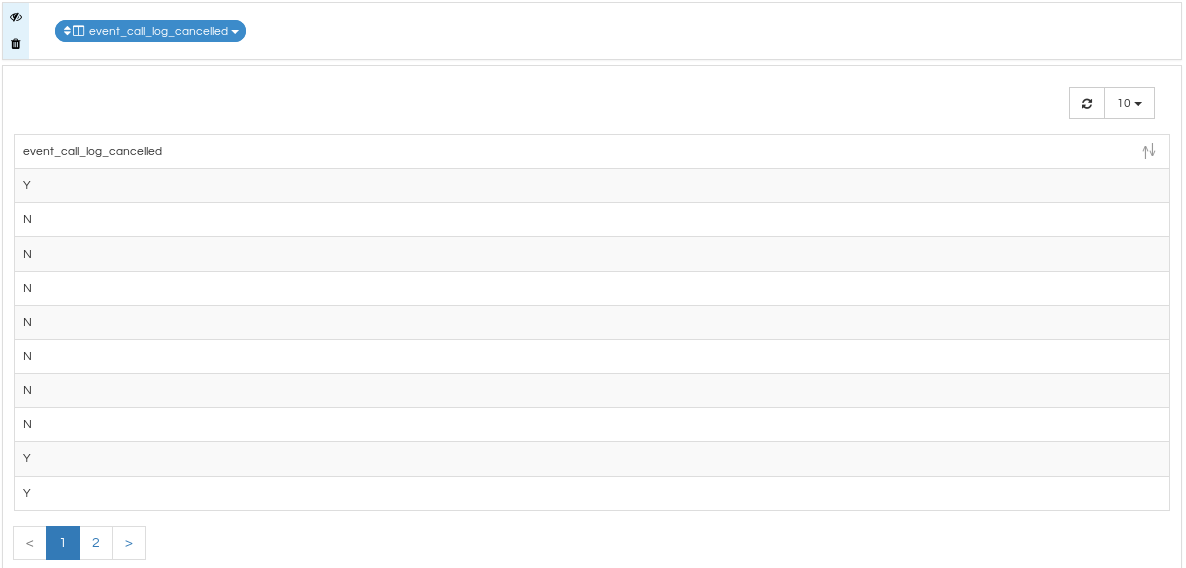
I expected to see a pie chart showing the ratio of cancelled calls related to all calls.
When I click on the pie chart to create it, the page remains blank after loading, with a little blue hourglass at the bottom-right corner.

Here another example :

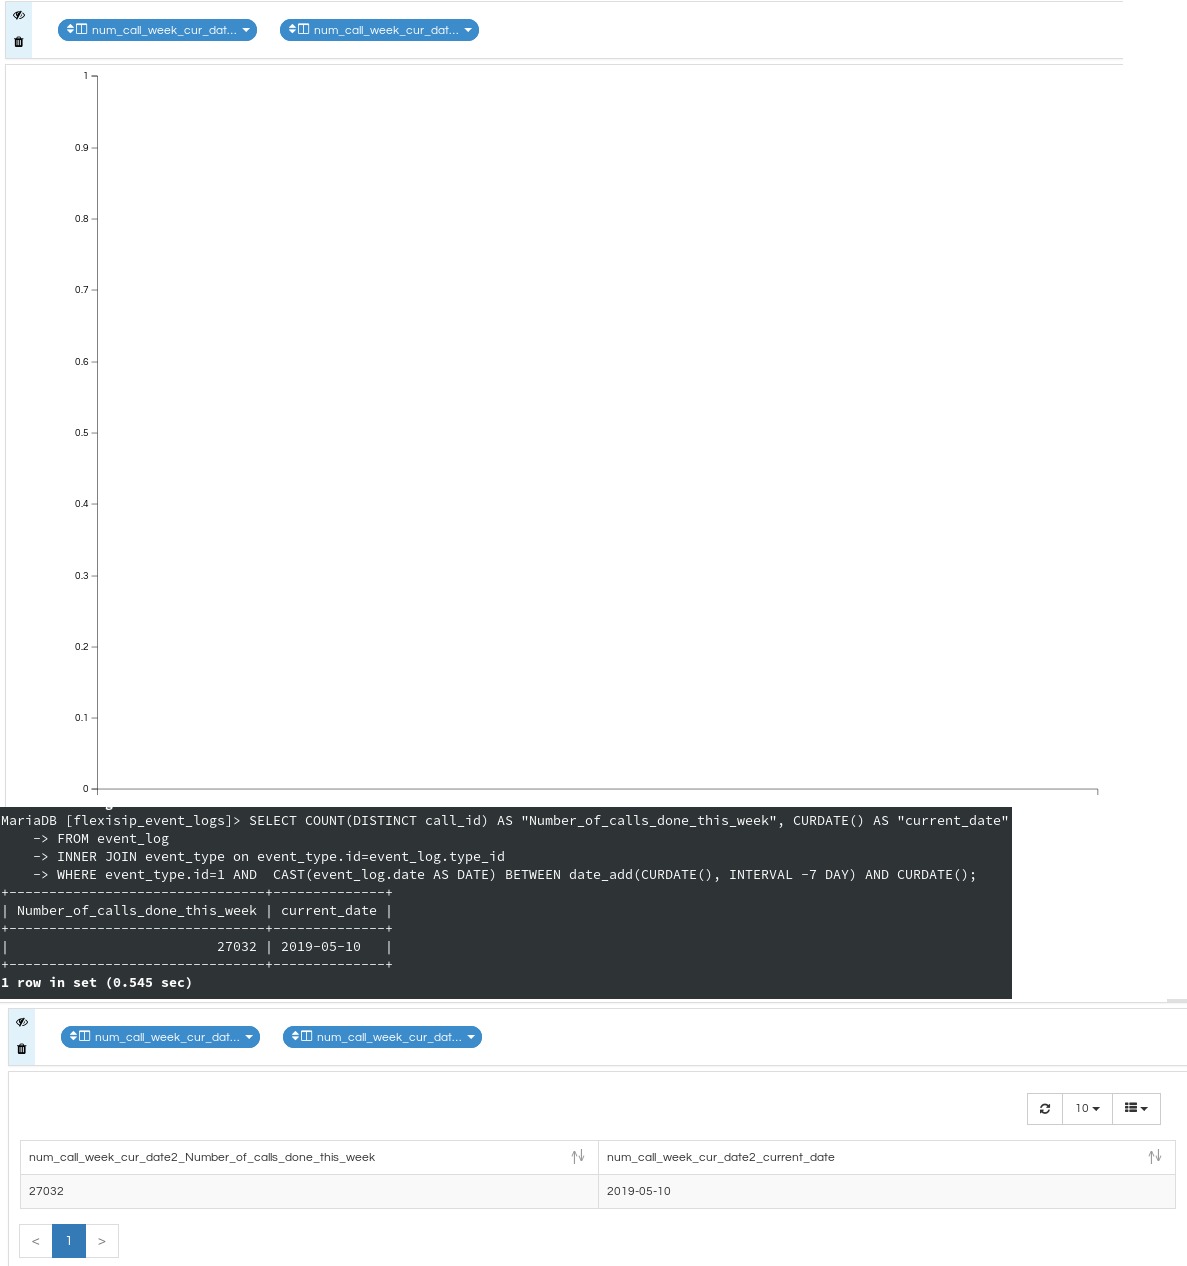
I tried to see in a pie chart the amount of calls done for the current day, the current week, and the current month.
All of this was done in 3 different SQL queries with a “count” for each. When I tried to drag & drop the given columns to generate a pie chart, I got the following error : QueryBuilderException: The table Number_of_calls is not joined with any other table in the metadata. Can’t build SQL. Please define joins before you use the table.

Do I have to manually compute the values and gathering it into a table before chart generation ? I do not know the specific input expectations of the software regrading charts.

Hi Peio,

You are not able to generate the pie chart as it requires 1 dimension and 1 measure.
You need to drag one more column. (e.g. Date, Client, Source etc.)
Once you have done that, click on “Pie Chart” visualization and you will get the desired result.

For your other example,
If you want to see number of calls in a day/week/month, once again you need to have 2 columns:

  1. Date - You can extract the week/month by using Advanced Database functions by clicking on “More” in the dropdown list that appears when you click on a column
  2. Call event (count). You can select count option from the aggregate function list available on click of column

For such data, a bar/time series chart will give you a better representation of the data as compared to Pie.

Thanks for your reply.
Can I define the dimension manually (without a db field) ?

To get the number of calls per-week, I used previously this query (event_type.id=1 is a code for a call event) :

SELECT COUNT(DISTINCT call_id) AS “Number_of_calls_done_this_week”
FROM event_log
INNER JOIN event_type on event_type.id=event_log.type_id
WHERE event_type.id=1 AND CAST(event_log.date AS DATE) BETWEEN date_add(CURDATE(), INTERVAL -7 DAY) AND CURDATE()

To get the bar series working, I tried to add the current date to my query, for testing purpose, so I modified the last query like this :

SELECT COUNT(DISTINCT call_id) AS “Number_of_calls_done_this_week”, CURDATE() AS “current_date”
FROM event_log
INNER JOIN event_type on event_type.id=event_log.type_id
WHERE event_type.id=1 AND CAST(event_log.date AS DATE) BETWEEN date_add(CURDATE(), INTERVAL -7 DAY) AND CURDATE()

I expected a chart to be displayed, with one bar scaling to the only measure (number of calls per week), and the current date below, but only a blank graph was displayed, with the blue hourglass at the bottom right corner saying “Last Cached: Invalid date”


As you can see above my query seems correct…

Can you please explain me what I’m doing wrong ?

Hi,
In order for any chart to work there should be groupby applied on dimension and an aggregate function (like sum/count/average/max/min etc) should be applied on a measure.

Here we can see that you have not applied these functions and that is why it is not appearing in the form of a chart. Though it can appear in the form of a table.

Please refer to this blog to understand how to apply aggregate function

Thanks, I managed to create a chart with your advice.
However, it appears that I can’t create a single chart from multiple views (even if the measures are of the same type).
When I try to do this (number of calls in a day/week/month and total) I get the following error :

“Error: QueryBuilderException: The table Number_of_calls_last_month is not joined with any other table in the metadata. Can’t build SQL. Please define joins before you use the table.”

It seems that I may be missing something again…
Do the queries must need to be in the same view before the report generation ?
And if so, can I run multiple queries in a single view ?

I may say something wrong, but I didn’t find this information in the doc

It seems that you are trying to drag two columns from different tables but they have not been joined with each other. Hence our application is not able to make SQLQuery. At the metadata level please make sure that you have defined the joining conditions between them.

Please refer to this blog to learn how to make joining conditions

Thank you for your patience. After a call I understood how to use the report creator.