Hello Alfredo,
The image shared is very small and not visible. can you share a bigger image. Aside below we are elaborating the standard steps of creating map.
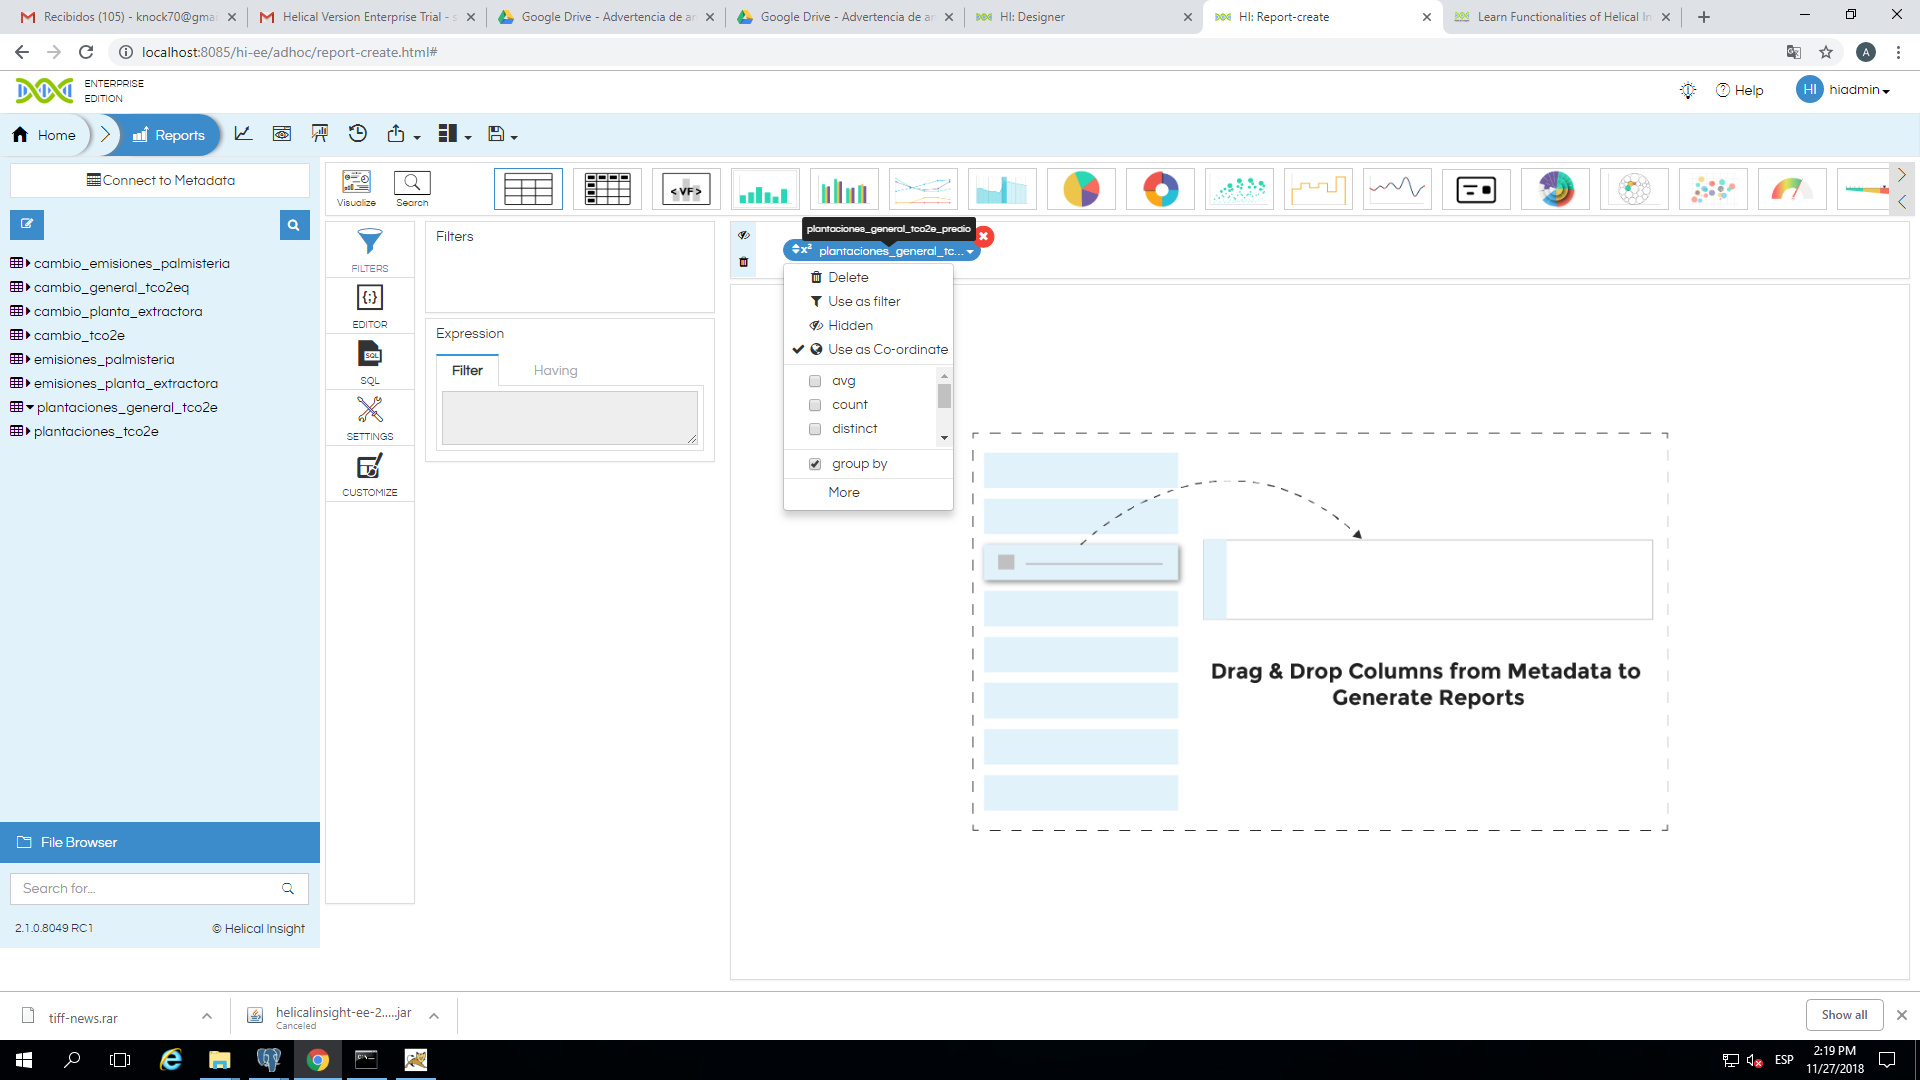
Step1: Select 2 columns i.e. one dimension and one measure, for example location and travel cost.
Step2: Select dimension as a “group by” and measure as “sum” or other aggregation function like “count”, “max”, “min” etc
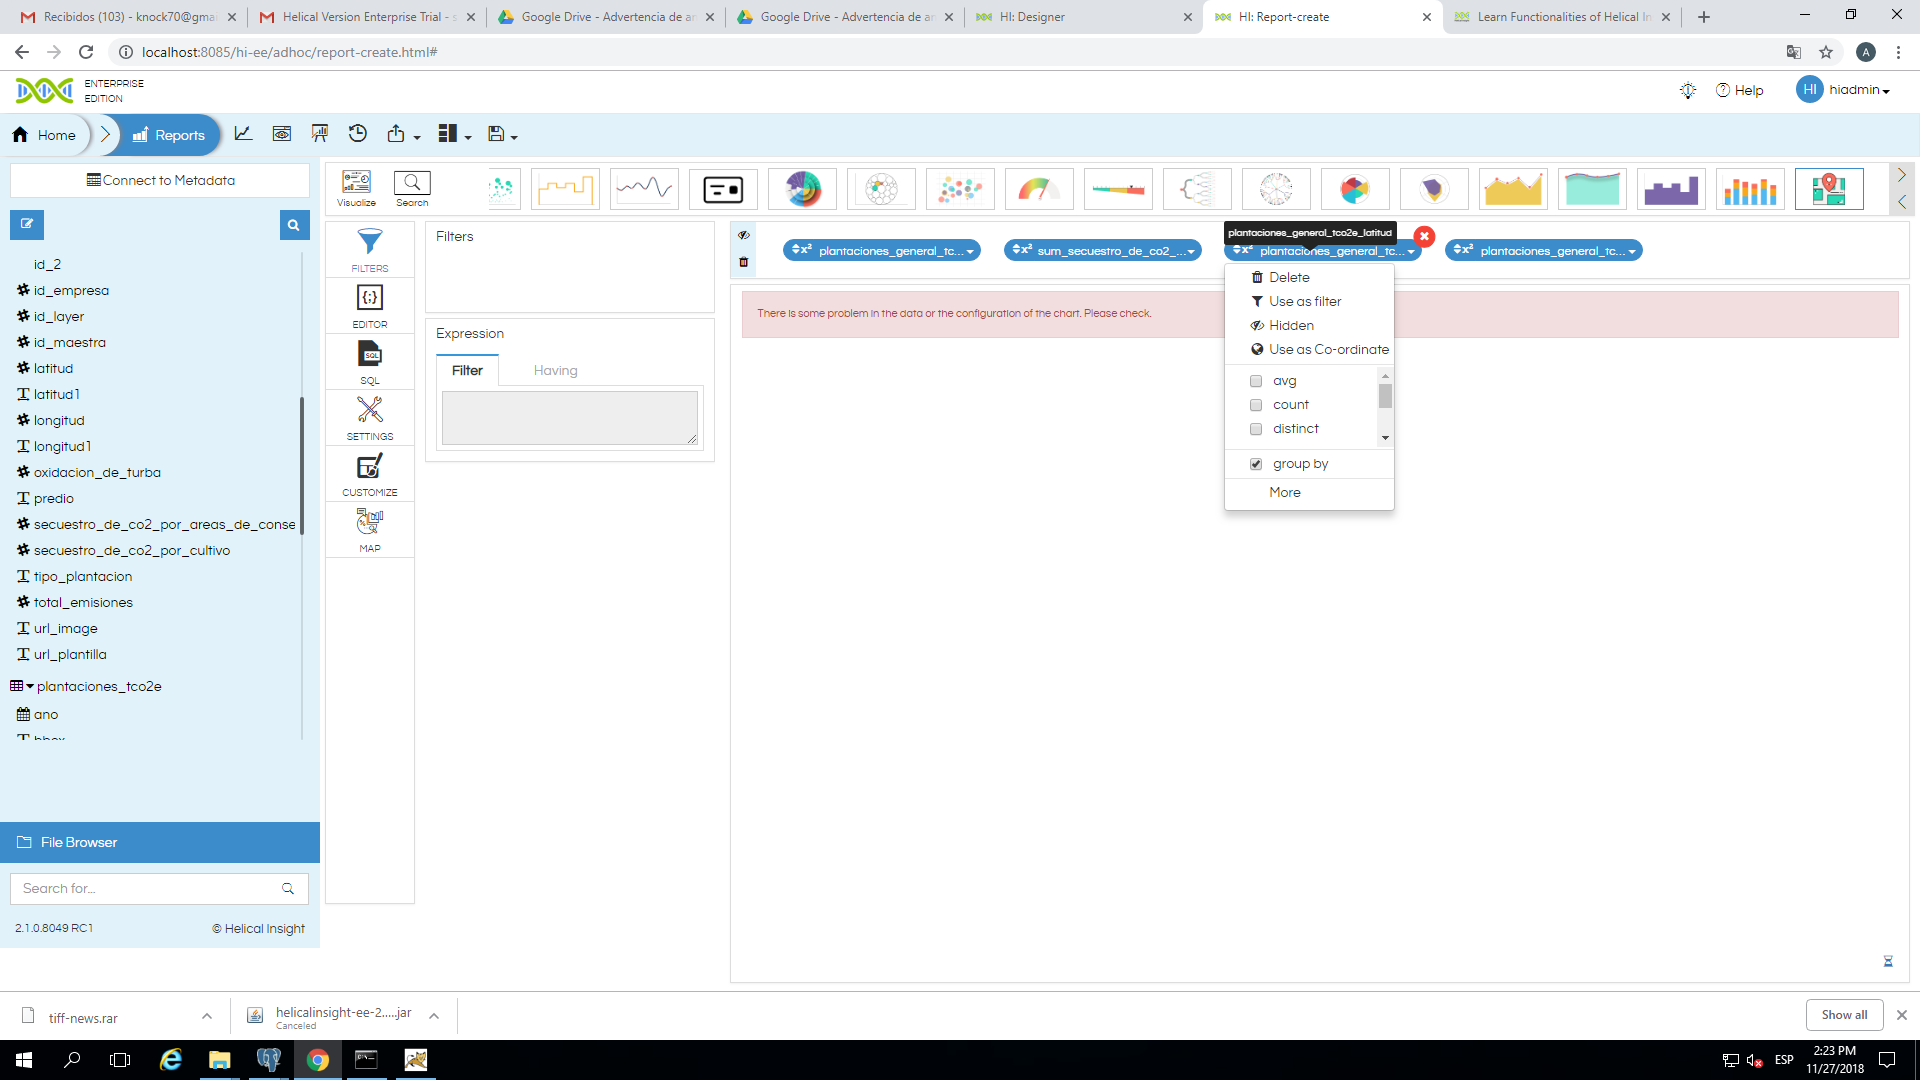
Step3: Select one column as a “use as co-ordinate” or also you can use latitude and longitude also as a “use as co-ordinate”
Step3: Drag latitude and longitude column and make them as a “group by”
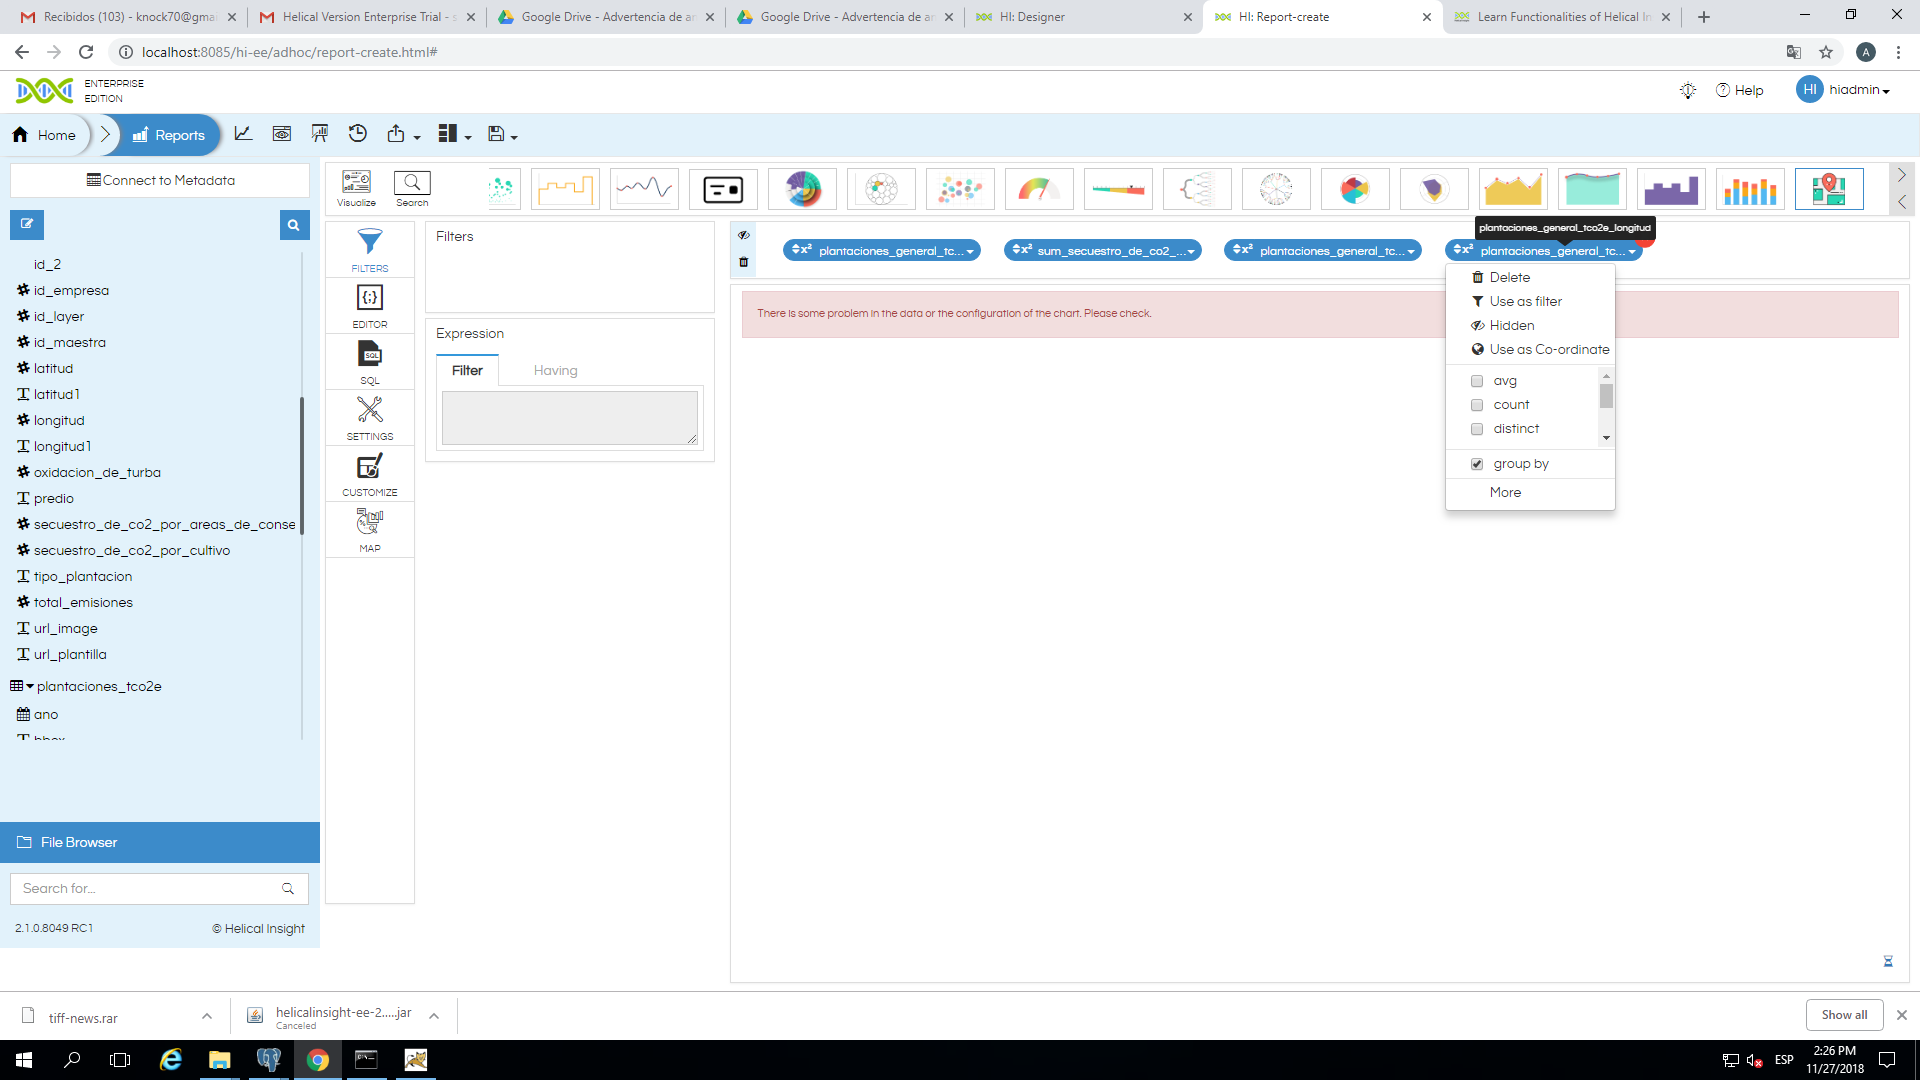
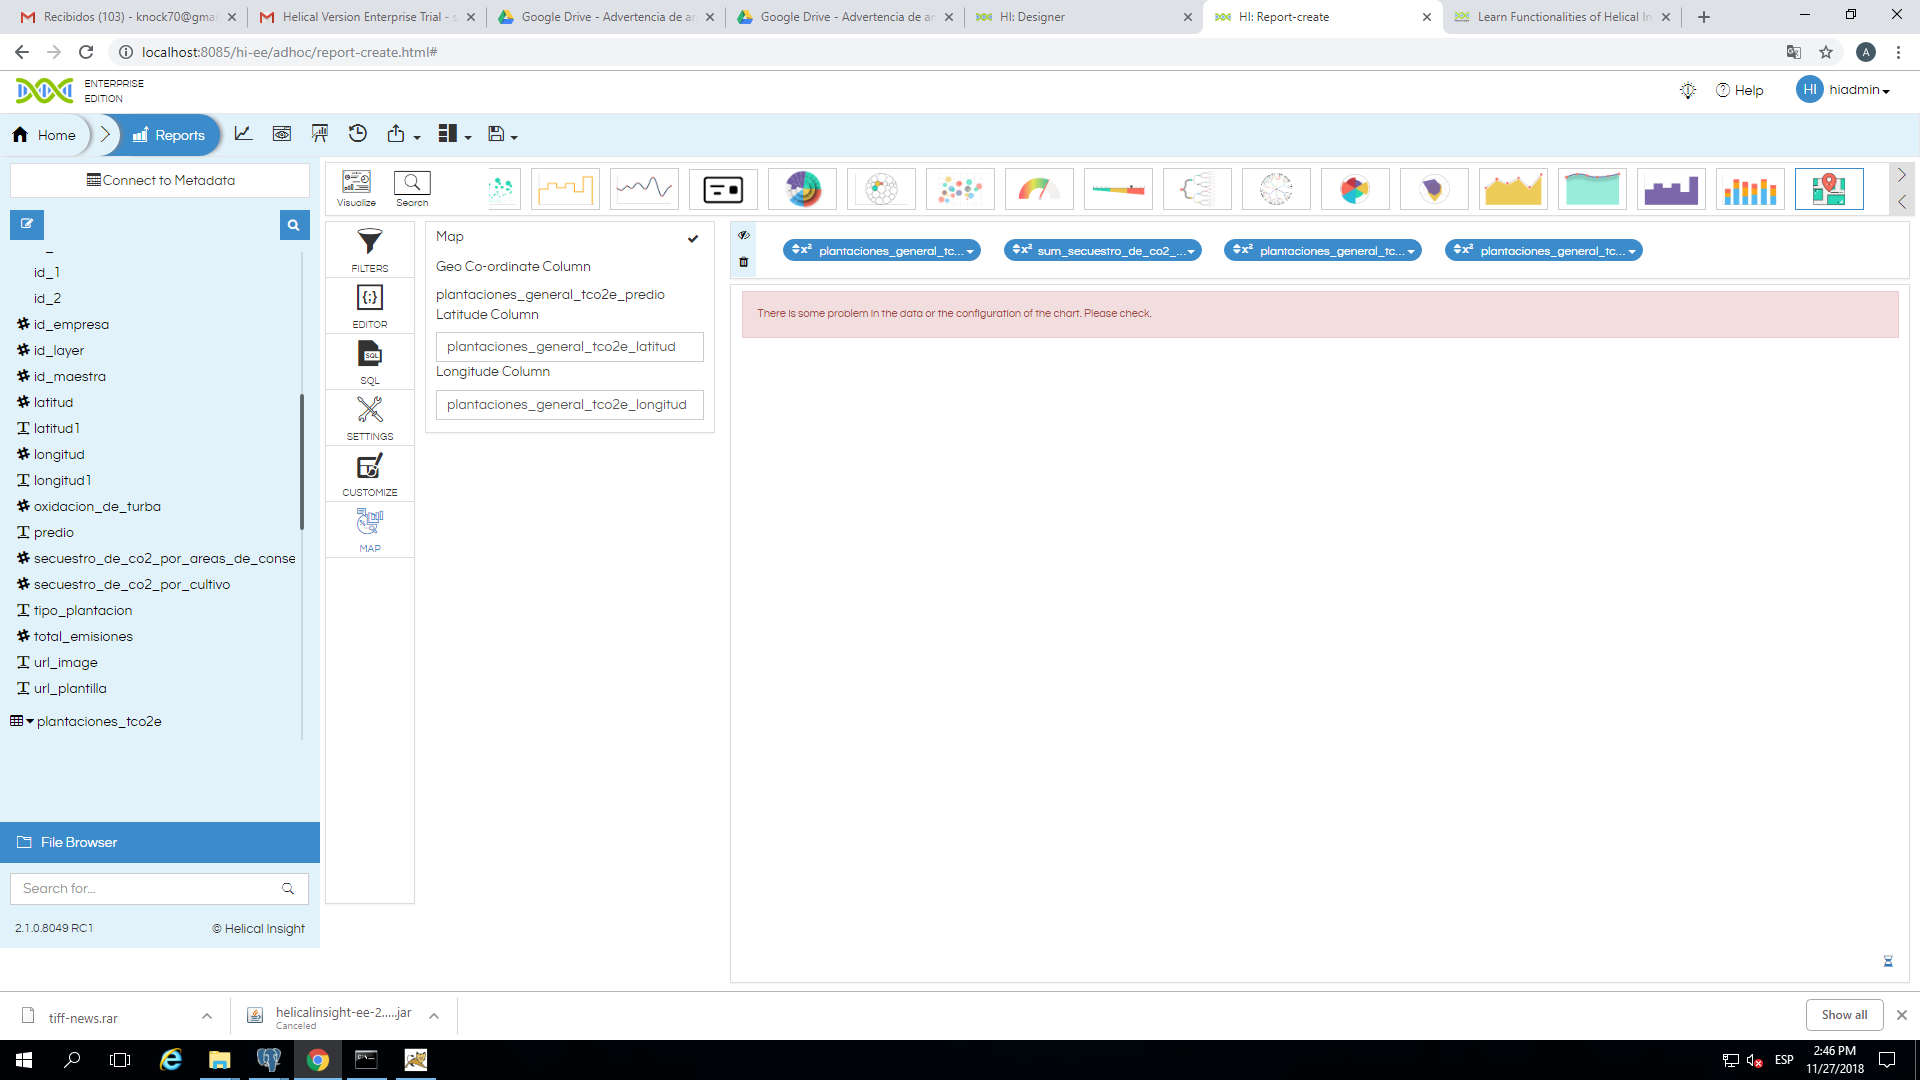
Step4: Now select map chart and you will see map customization below customize option.
Step5: Select “Map Customization”. You will see options to select latitude and longitude column
Step6: Select “latitude” and “longitude” column in map customization
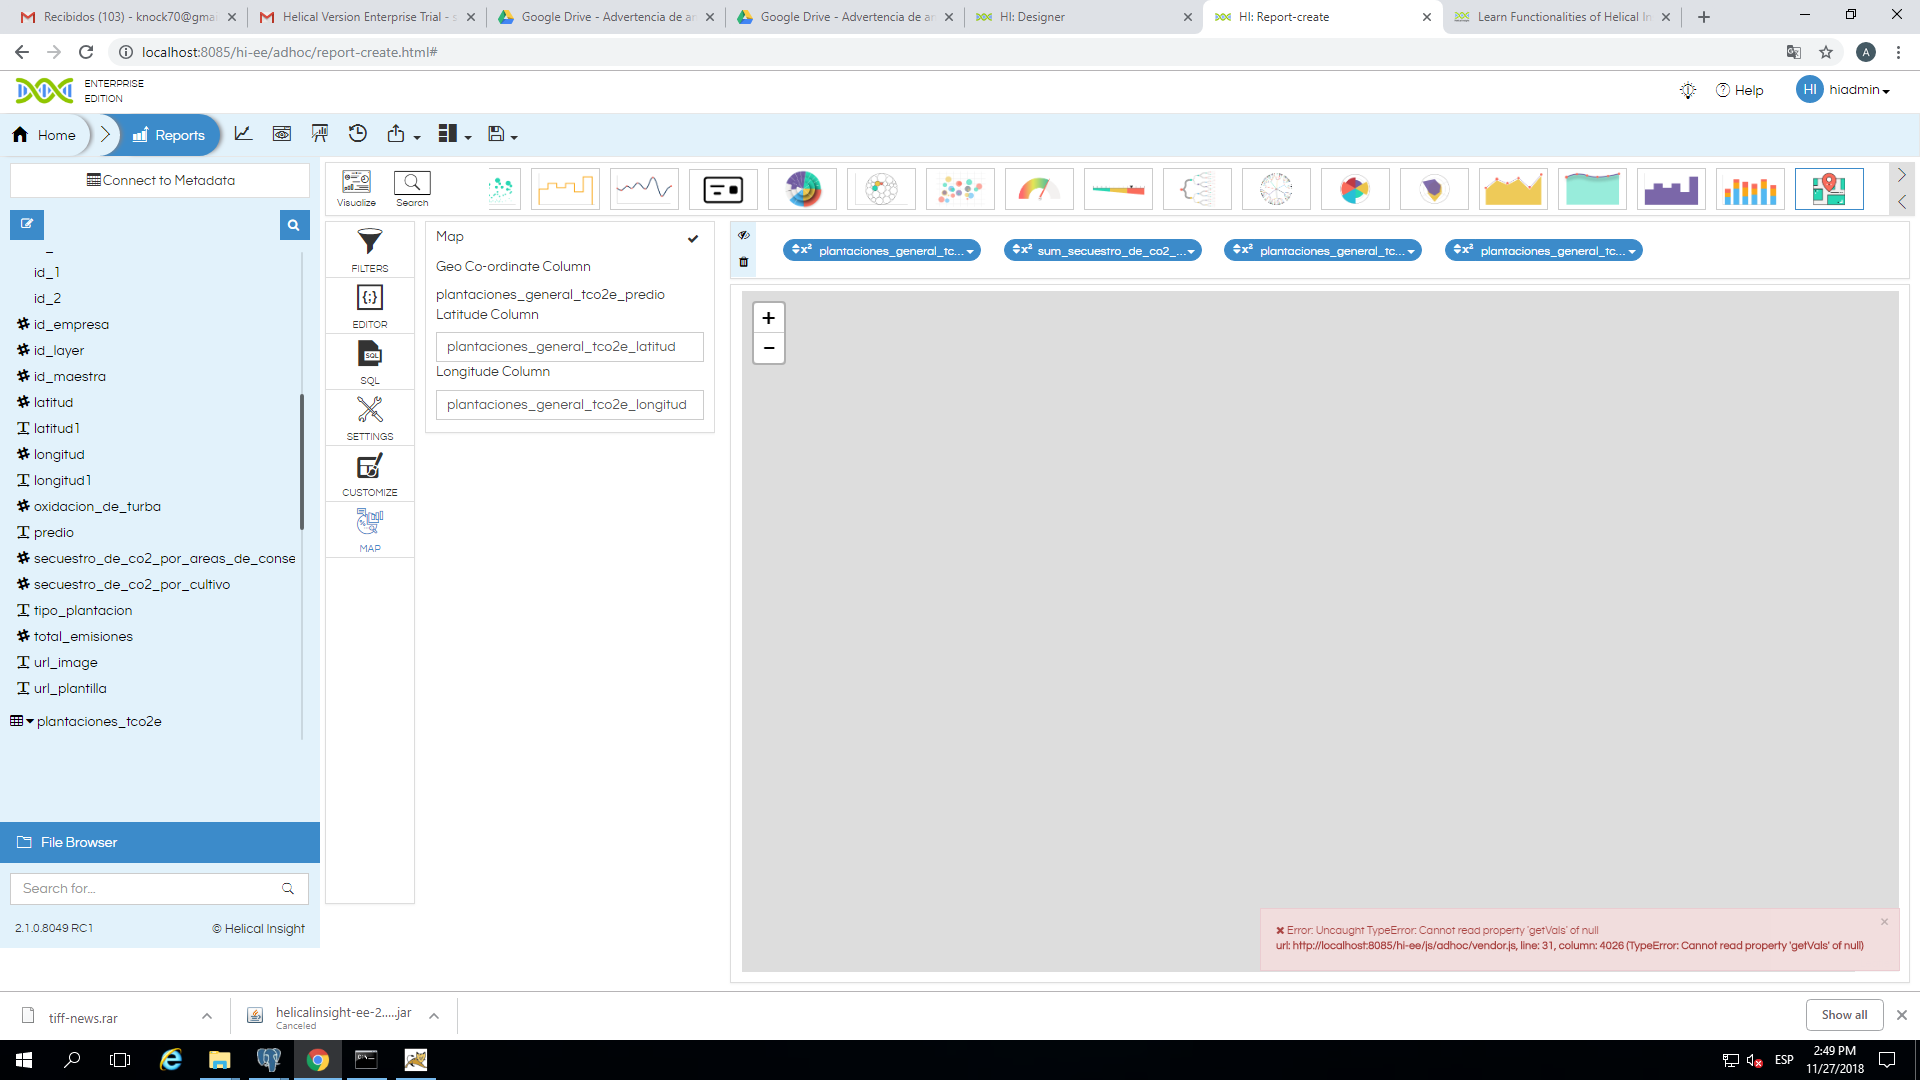
Step7: Click on “apply” which appears as tick mark on top of map customization
Step8: Generate map
Can you also provide more screenshots so that we can understand what all fields are being used in selection? Also Map customization snapshot as well. This will help us troubleshoot.