Performance Issues When Using an API Data Source in Helical Insight

Snipaste_2026-07-27_16-52-47

Hello Helical Insight Team,
We are currently using Helical Insight 6.2 and are trying to use an API as a metadata source for report creation.

Our API typically returns approximately 20,000 to 50,000 records, and sometimes even more. The API request itself takes only around 400 ms, but the report takes approximately 8 to 15 seconds to load.

I noticed that the Helical Insight website mentions a Streaming Response Enhancement feature that can be used to improve performance:

https://www.helicalinsight.com/helical-insight-6-2-streaming-response-enhancement/

However, when I changed the following configuration:
false
to:
true

an error occurred while creating the report:
Error: NullPointerException: Cannot invoke “java.sql.ResultSetMetaData.getColumnCount()” because “” is null

I also tried changing only the other streaming-related configurations, but there was no noticeable improvement in the request or report-generation time.

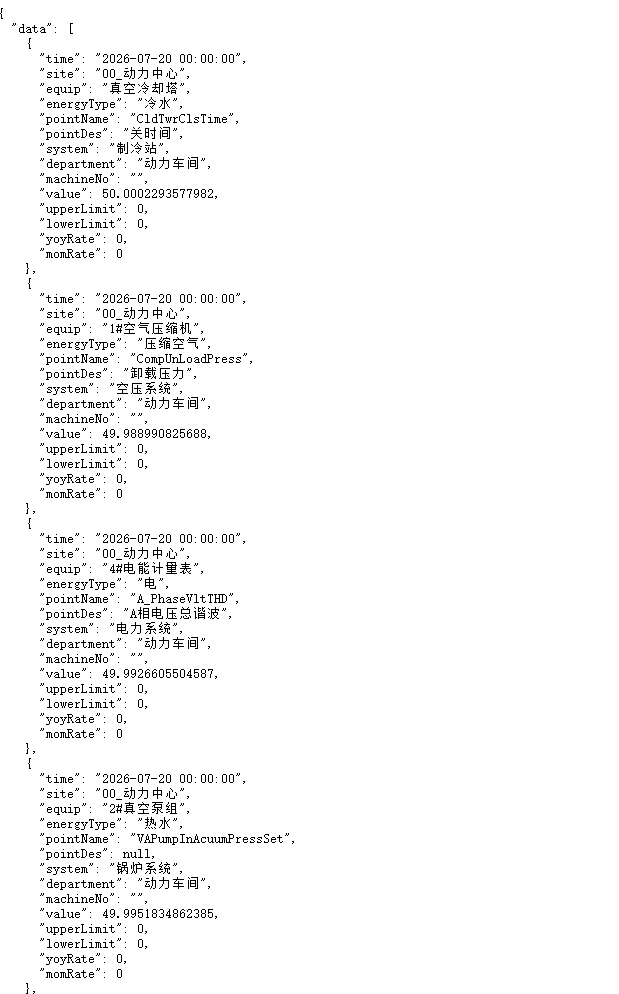
The API response format is shown in the attached screenshot.

Could you please advise how we can optimize report creation performance when using an API data source with this volume of data? We would also like to know whether the Streaming Response Enhancement feature supports API-based data sources, and whether any additional configuration or limitations apply.

Thank you.

Snipaste_2026-07-27_16-59-28

The image below shows the configuration changes mentioned above.

Hello Sunshine,

Thank you for providing the details.

Based on your description, a few points are worth clarifying:

  1. Streaming Response Enhancement
    The Streaming Response Enhancement feature mentioned in the blog post is primarily intended for HCR (Helical Canned Reports), i.e., multi-page, pixel-perfect, printer-friendly reports. It is not designed specifically for API-based metadata sources used in ad hoc reporting. (Canned Report - Helical Insight)

  2. API Response Size
    Although your API itself is responding in approximately 400 ms, transferring and processing 20,000–50,000+ records still requires time for:

  • Receiving the complete payload
  • JSON parsing
  • Metadata generation
  • In-memory object creation
  • Report rendering on both the server and browser
  1. Server Hardware
    Could you please share the hardware configuration of the server where Helical Insight is installed?
    Specifically:
  • Number of CPU cores
  • RAM
  • Operating System
  • Whether Helical Insight is running inside Docker or directly on the host machine
  • Server is dedicated for Helical Insight or other applications are also running on the same server.
  1. JVM Memory
    If the application is processing large API responses, increasing the JVM heap size may improve performance by reducing garbage collection overhead and allowing more data to remain in memory during report generation.
    You can refer to the following guide for increasing JVM memory:
    How to Increase JVM Memory in Helical Insight Application?

  2. Additional Recommendations
    Depending on your use case, you may also consider:

  • Reducing the number of records returned by the API through pagination or filtering.
  • Returning only the columns required by the report.
  • Monitoring JVM memory usage and garbage collection while the report is being generated to determine whether the bottleneck is CPU, memory, or network related.

Please share the server hardware specifications and current JVM settings. That will help us determine whether the observed response time is primarily due to infrastructure limitations or if additional optimization is possible.

Thank you